
Better Error Stack Trace with Node.js Source Maps and Sentry


When building Node.js applications, reducing the bundle size is essential for specific applications, such as Serverless applications, which impact the cold start, and Single-Page Applications, which affect the initial page load.
One method for reducing the bundle size is to minify the JavaScript code, but it does not allow you to view a detailed stack of an error that occurs in production. Fixing a production bug as fast as possible is essential, and knowing where the code is throwing that error is the first step in fixing it.
This post will show how to bundle a Node.js project with generated source maps and upload it to Sentry. We will use Esbuild to bundle the project, but this tutorial can be applied to any other Node.js build tool.
Prerequisites
You need these tools installed on your computer to follow this tutorial.
- Node.js 20+ - Follow the installation guide I wrote.
- NPM or Yarn - I will use Yarn.
- A Sentry account - A free trial is enough.
Set up the project
To start with a working Node.js project, we will use the one we built on the below blog post:

The source code of this Node.js application can be found in this GitHub repository; let's clone it locally using the Git sparse-checkout.
git clone --no-checkout https://github.com/tericcabrel/blog-tutorials.git

cd blog-tutorials

git sparse-checkout init --cone

git sparse-checkout set deploy-node-app

git checkout @
The project is now available locally, launch it by running the following commands:
cd deploy-node-app

cp .env.example .env

yarn install

yarn start
Open your browser and navigate to http://localhost:4500.
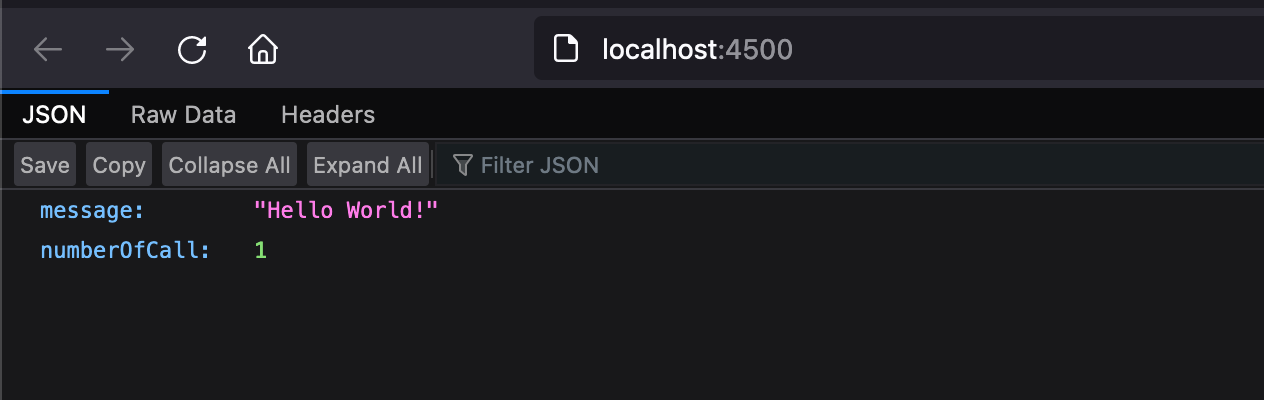
The project is built with TypeScript, which transpiles the TS files into JavaScript files.
Build the project with Esbuild
Esbuild is an extremely fast JavaScript bundler and minifier that improves web development through efficient tree-shaking and parallel processing.
Bundle a Node.js project with Esbuild outputs a single JavaScript file containing the source code and all Node dependencies required to run the project. This has the following benefits:
- No need to install the Node.js dependencies when deploying the Node.js application in production.
- A standalone JavaScript file is easy to manage and share.
- It reduces the start-up time (cold start) for Serverless functions because of the light bundle size.
- It is easier to cache the file through a CDN.
Let's install Esbuild as a dev dependency
yarn add -D esbuild
Run the command below to bundle the project:
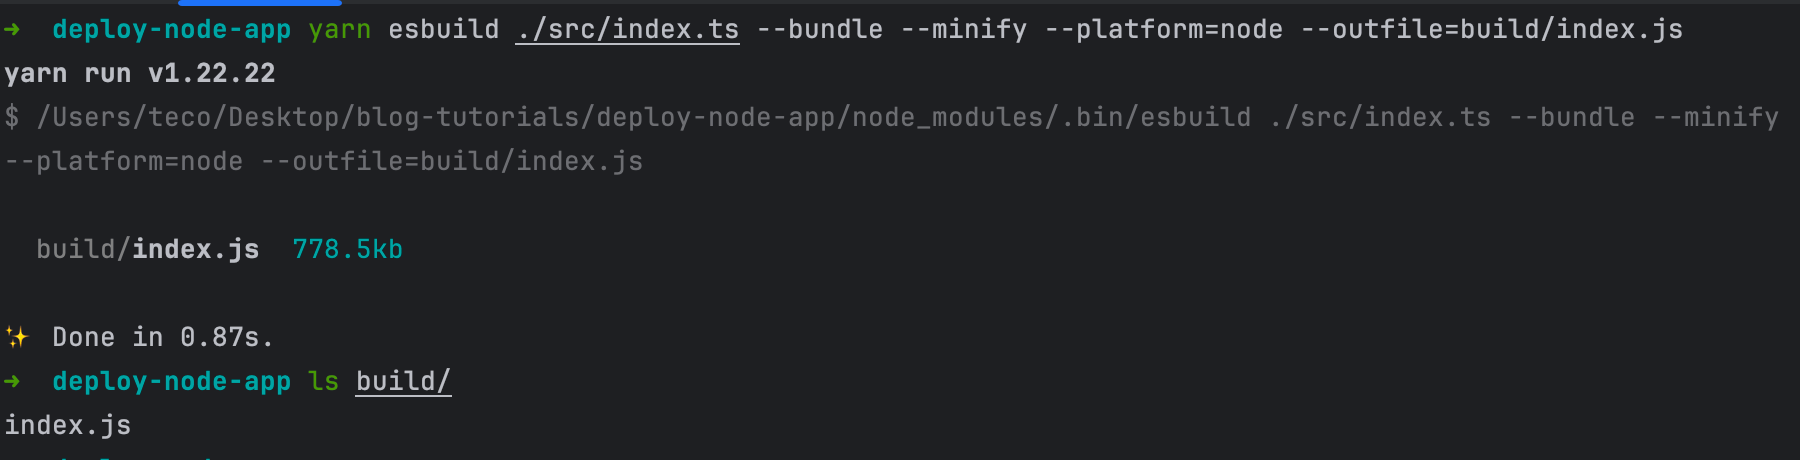
yarn esbuild ./src/index.ts --bundle --minify --platform=node --outfile=build/index.js
The above command created a folder named "build" with one file inside named "index.js".
Execute the file with Node.js by running the command below:
node build/index.js
The Node.js application is still running as expected, but let's add a function that intentionally throws an error.
Visualize the error stack trace in a Node.js application
Create a file called "src/route.ts" and add the code below:
import { Application } from 'express';

export const setupRoute = (app: Application) => {
  app.get('/error', (req, res) => {
    if (Math.random() > 0.5) {
      throw new Error('Ka booom!');
    }

    return res.json({ message: 'No error!' });
  });
};
Call the "setupRoute()" function in the "src/index.ts" file to register the route created.
// Existing code ...........

setupRoute(app);

app.listen(PORT, () => {
  console.log(`Application started on URL ${HOST}:${PORT} 🎉`);
});
Run the application with the command yarn start, navigate to http://localhost:4500/error and refresh the page until you get the error.
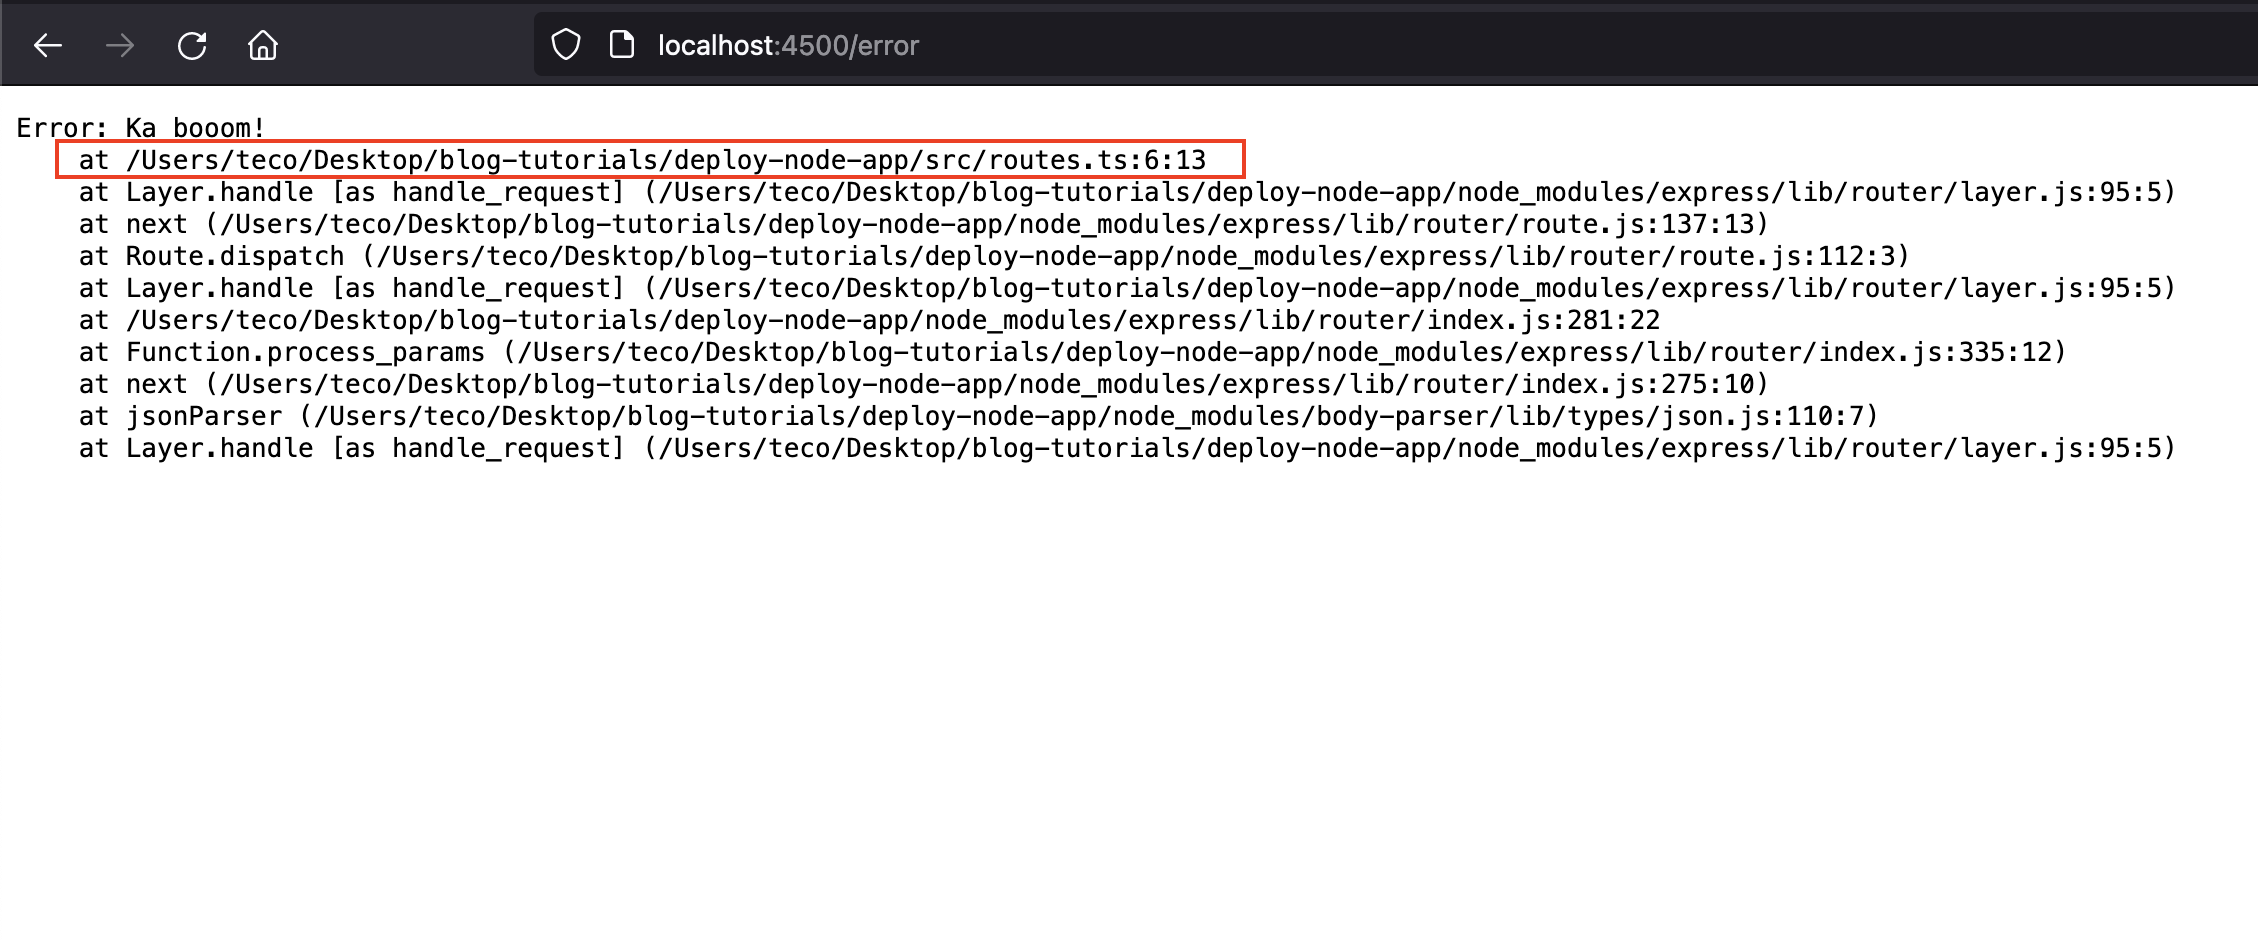
The error stack trace indicates the error occurred in the file "src/routes.ts" at line 6, column 13. This makes it easy to locate and fix a bug when working locally.
Let's build the application with Esbuild and run it
yarn esbuild ./src/index.ts --bundle --minify --platform=node --outfile=build/index.js

node build/index.js
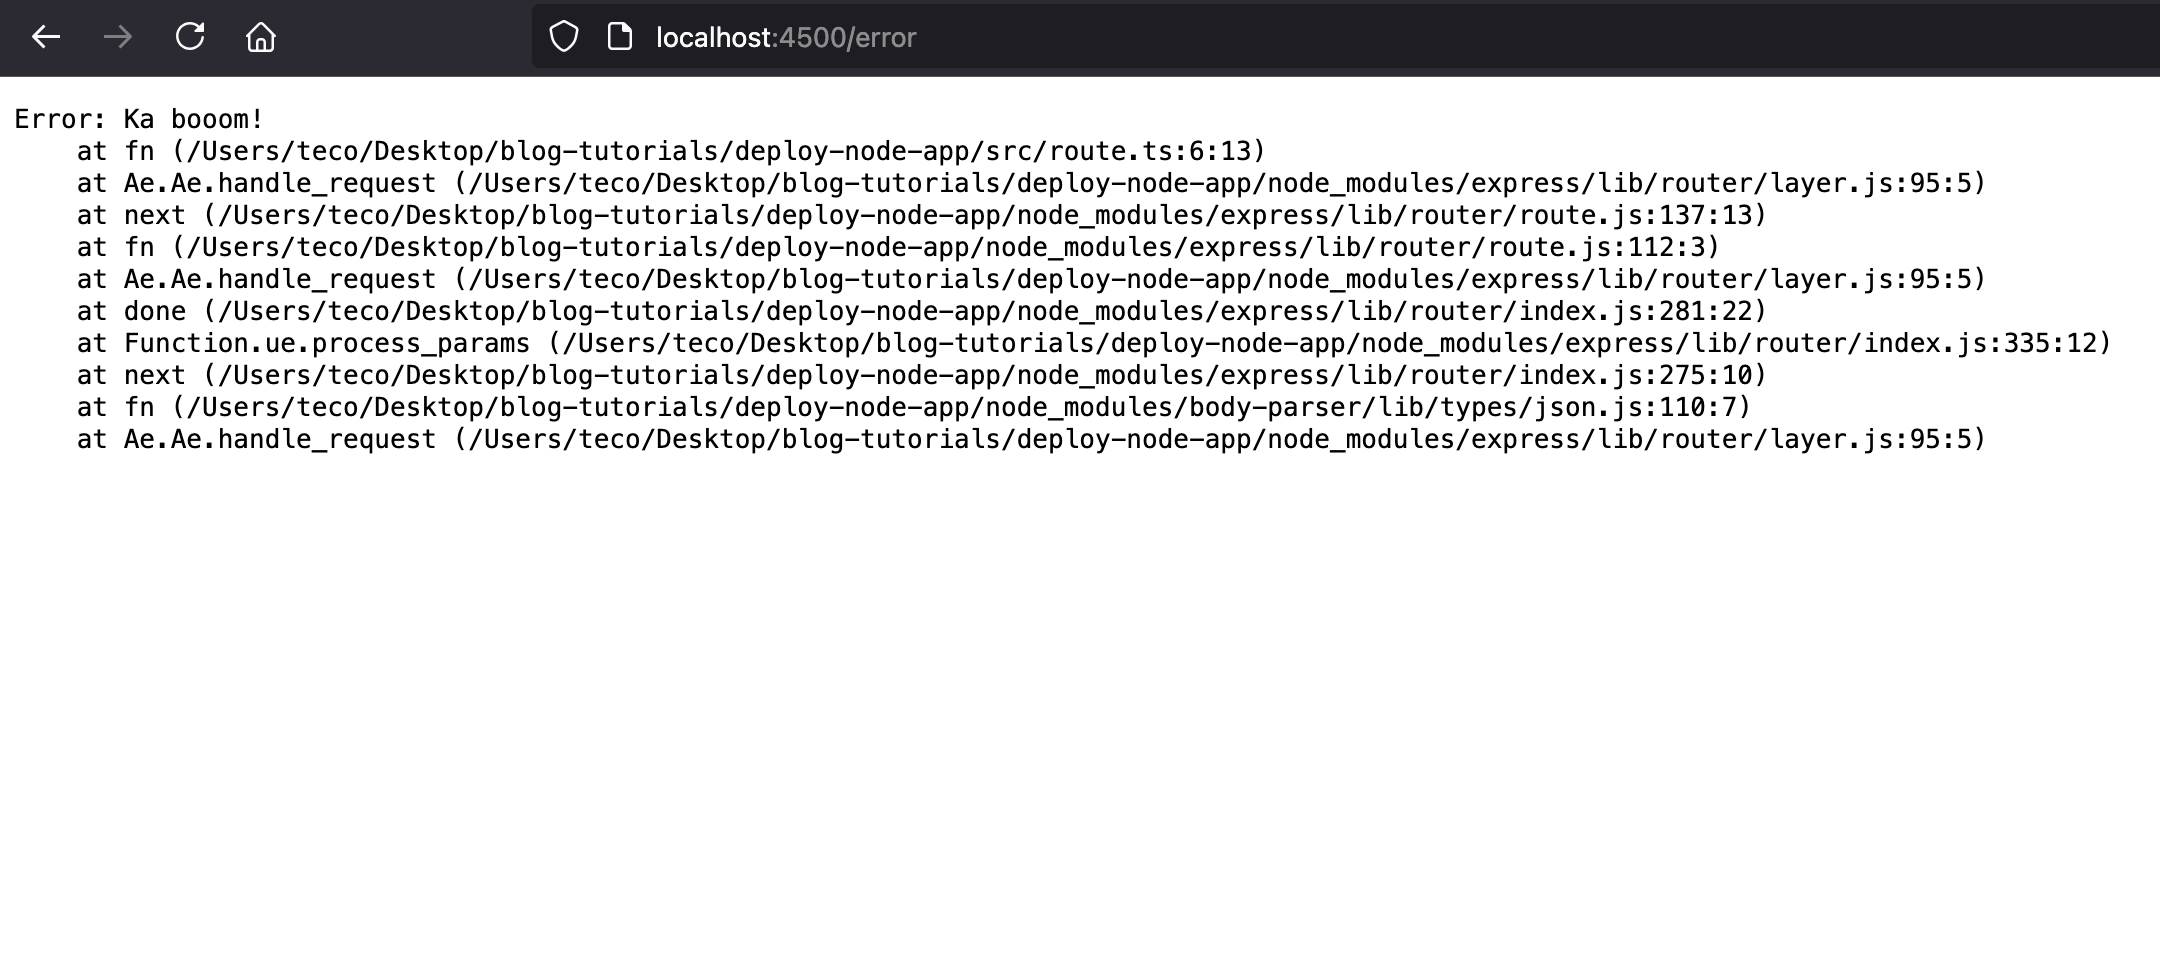
Go to the browser and test again:
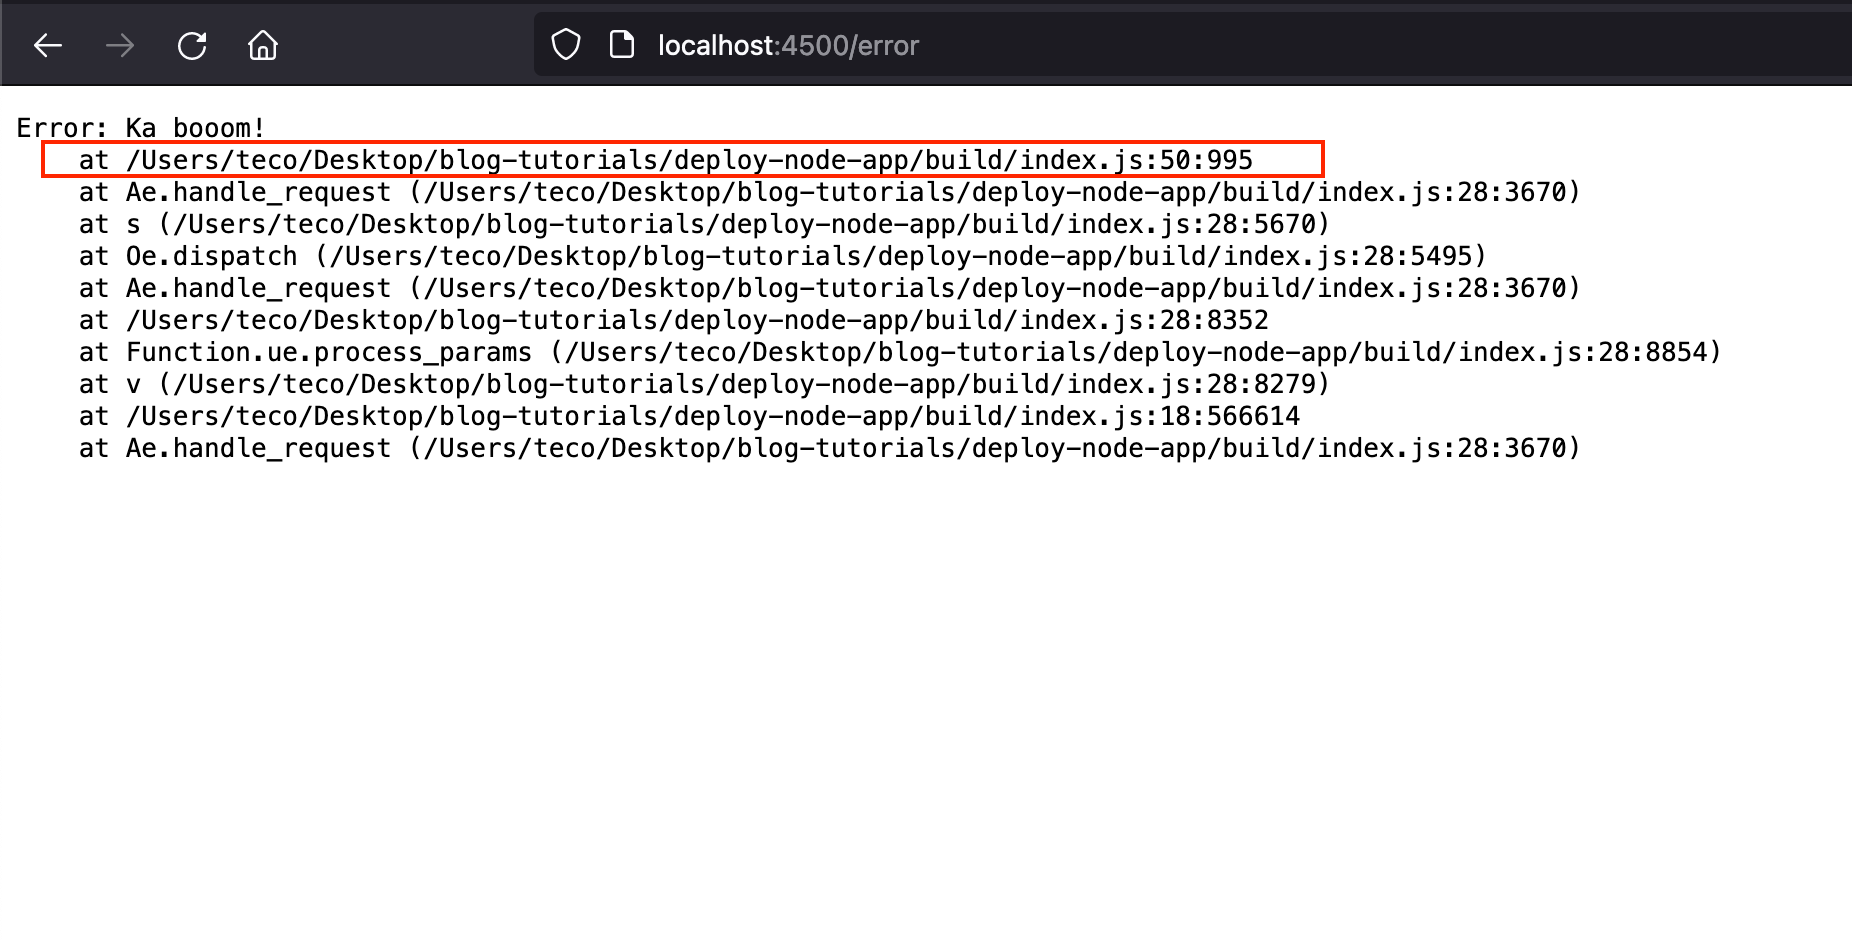
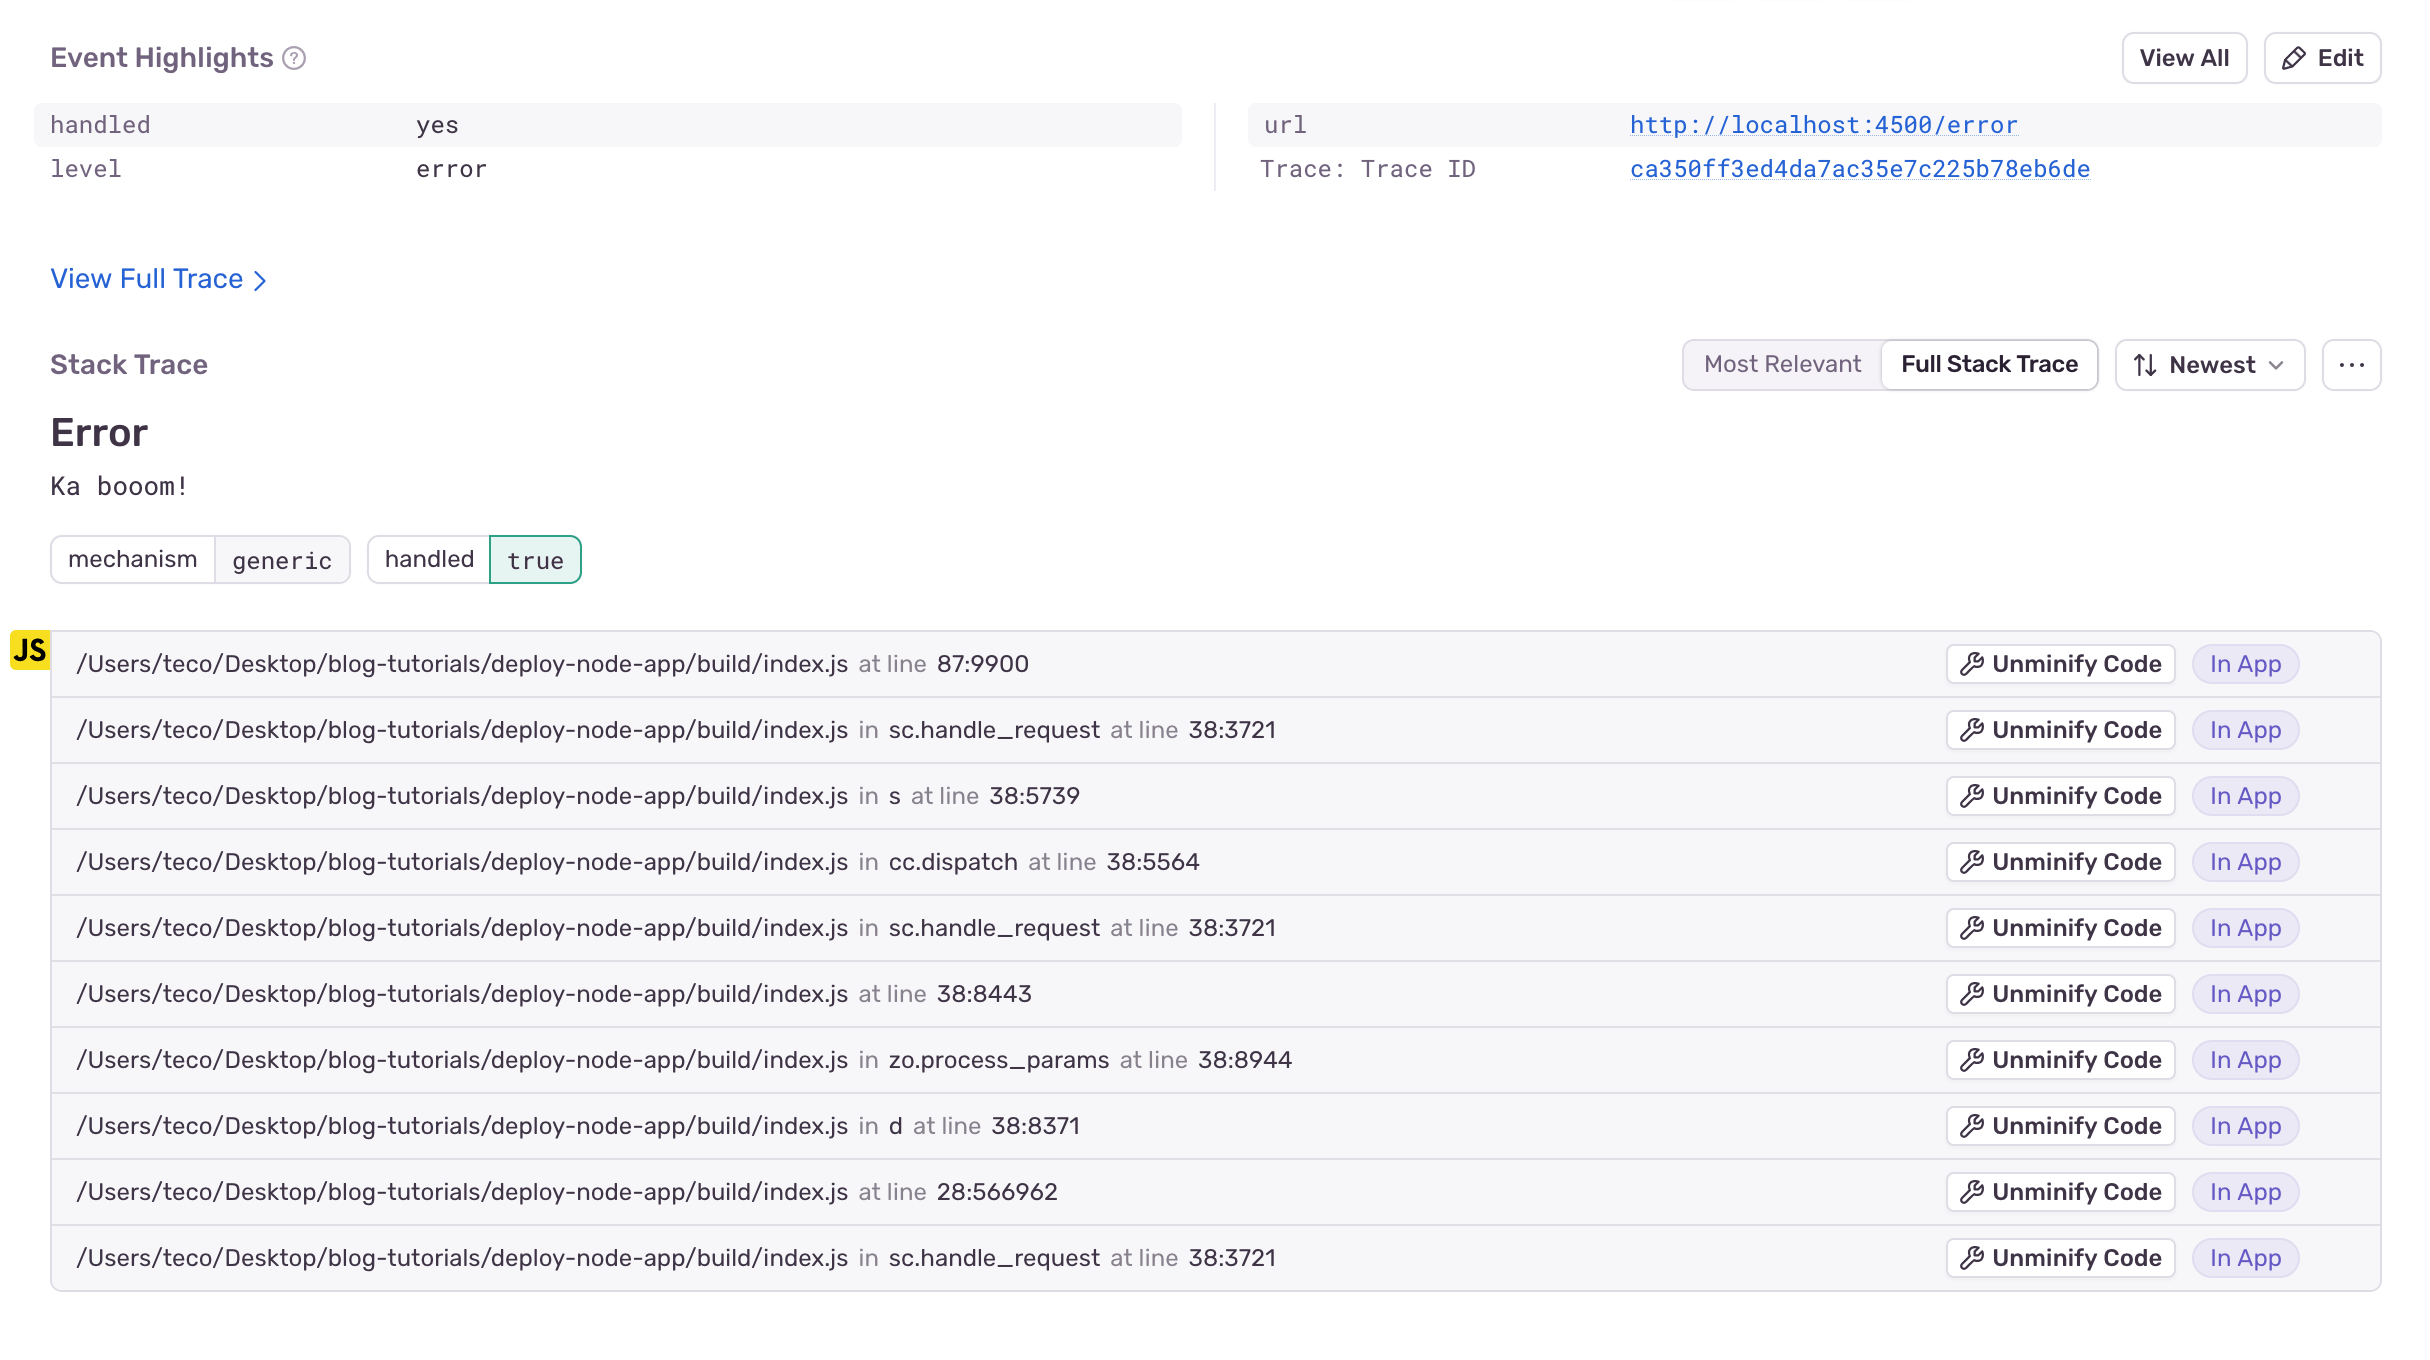
The stack trace indicates the error in the file "index.js" at line 50, column 995. Let's see what line 50 looks like:
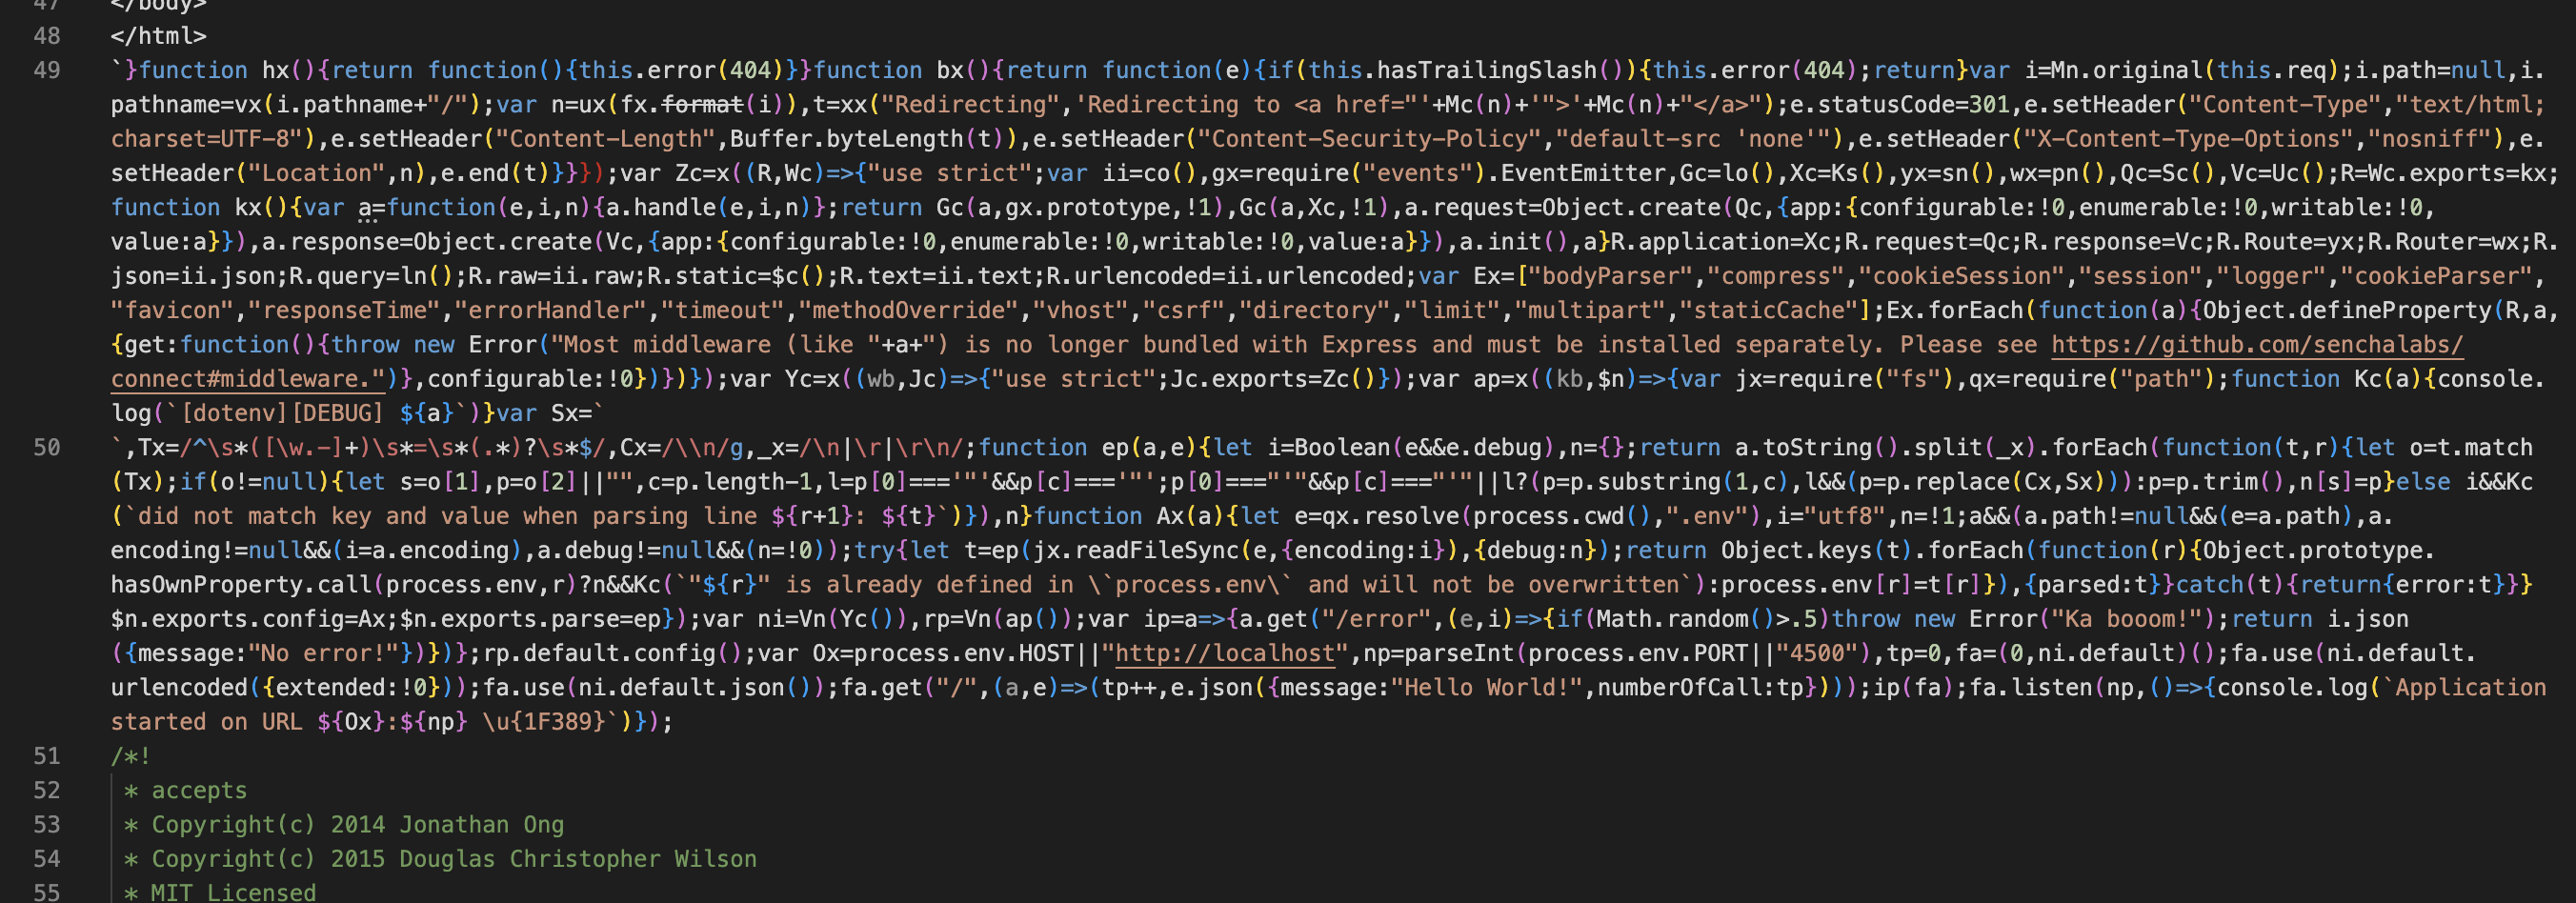
Not easy to read, right 😅? This is because we minimized the bundle using the flag --minify of Esbuild, which has the benefits of reducing the size.
We can debug our code locally, but when deployed in production, we cannot easily find the line where the bug occurred, which can increase our application's MTTR.
Generate source maps files in Node.js
When bundling the application with Esbuild, we can pass a flag to generate the source maps; It creates a mapping between the minified and actual source codes.
On the previous command used to build the application with Esbuild, add the flag --sourcemap to generate the source map.
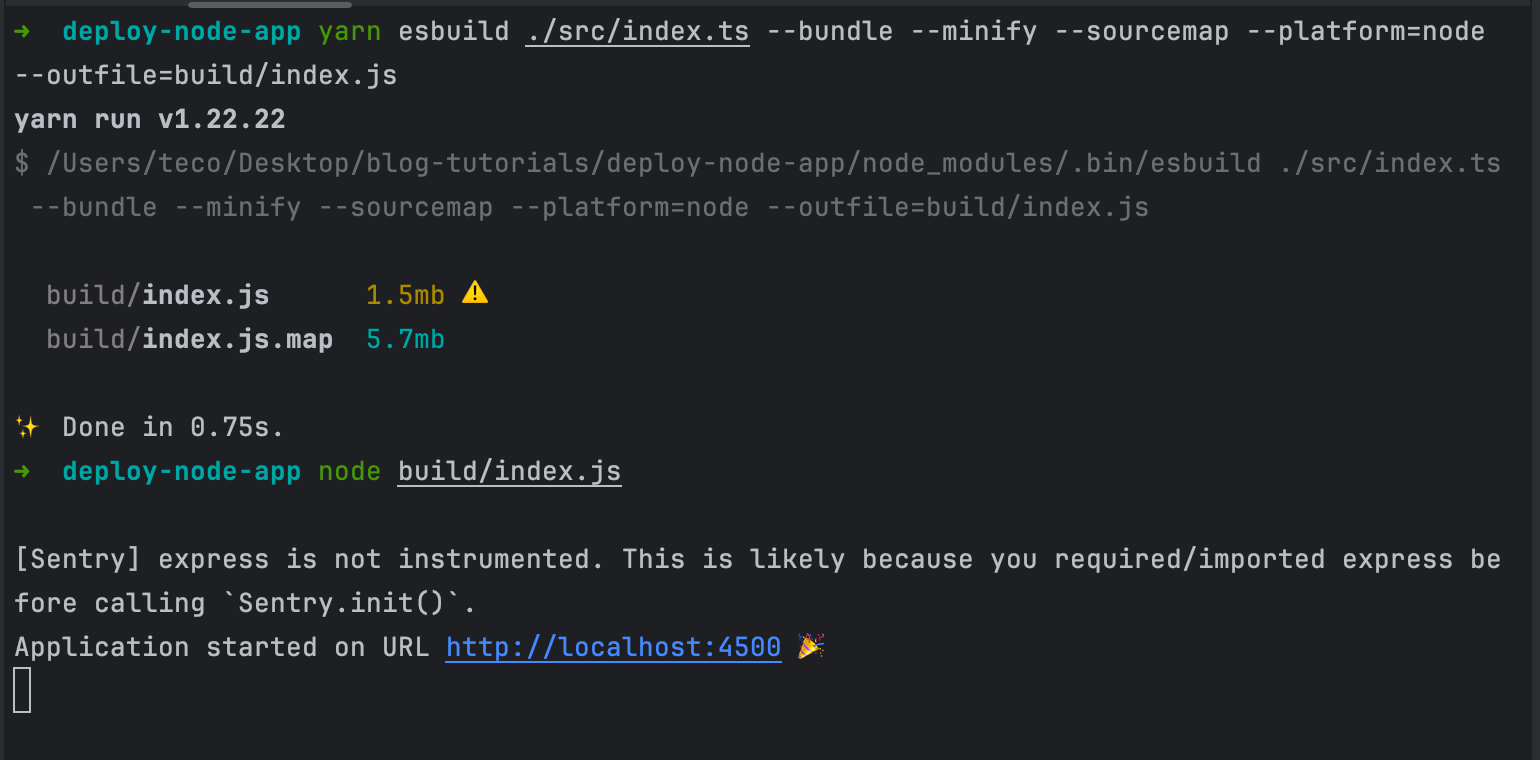
yarn esbuild ./src/index.ts --bundle --minify --sourcemap --platform=node --outfile=build/index.js
We get the following output:
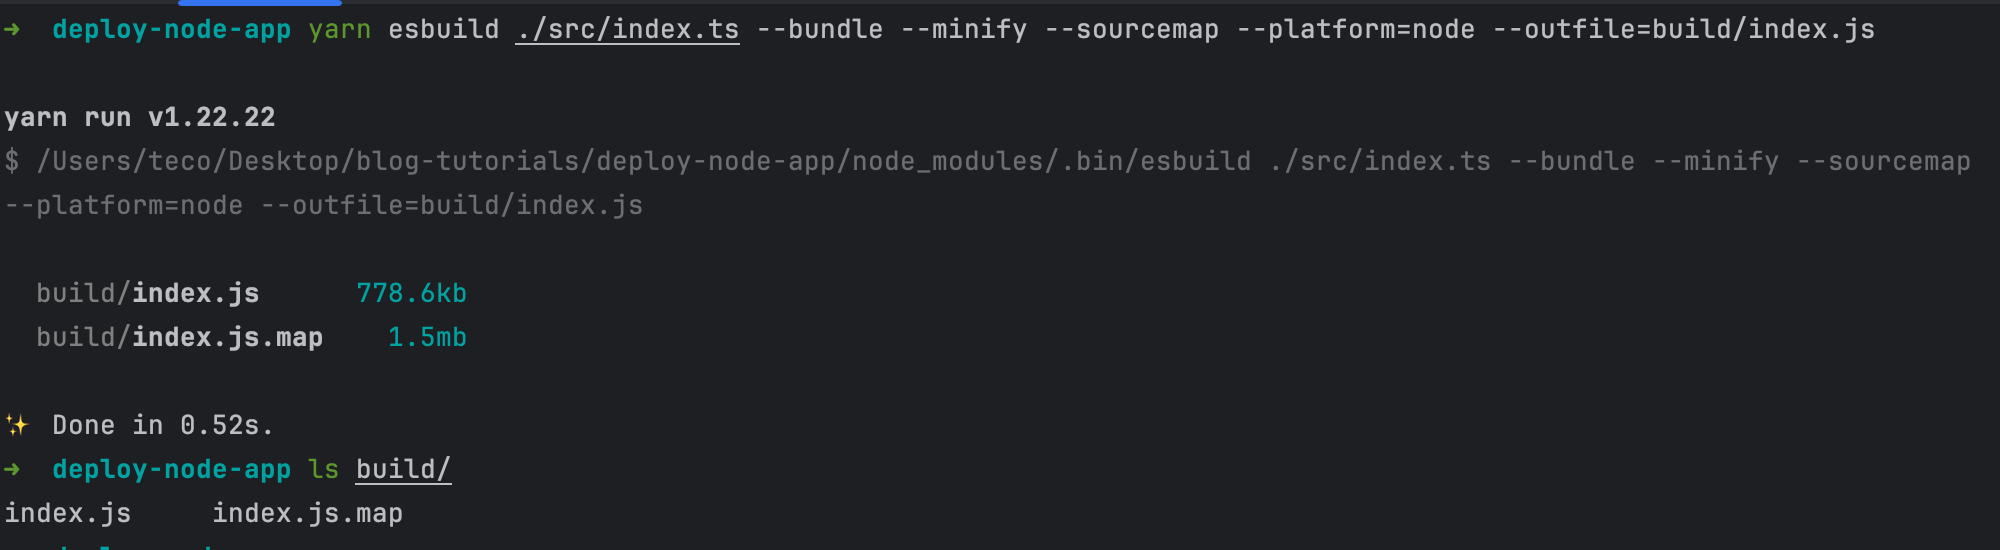
A "index.js.map" file is generated in the "build" folder. Now, we can run the bundled code with the source maps so that the Node.js runtime can use them to find the actual error line when a bug occurs.
As of version 12, Node.js natively supports source map, meaning you can run your application with the source map by passing the flag --enable-source-maps.
Run the project with source maps using the following command:
node --enable-source-maps build/index.js
Navigate to the browser and see the result:
Now we have a clear stack trace of the error in our source code.
So we can deploy the bundle with the source map in production 😌......... Hmmm, not really, because running a Node.js application in production with the source map is not recommended.
The problem with the source maps
Source maps slow the application in production, especially when their size increases. As you can testify with the build with the source map we did earlier, the source maps file size (1.5 MB) is usually bigger than the source code bundle (778 KB).
I will not cover the slowness of the application by the source maps, but here are the GitHub issues that discuss the problem and people made benchmarks so check it out:
 nodejs
This Twitter thread shows that the author found out the source maps added latency to the request.
Spent most of the day hunting a performance issue with Node.js on AWS lambda, found it, and fixed it.
— Vincent Voyer (@vvoyer) February 28, 2022
Execution time. Before: 1s, after: 150ms
To track and optimize such performance issues, read this quick debugging-horror-story-with-happy-ending thread 🧵
Fix the Node.js Source Maps problem with Sentry
Sentry is an application monitoring tool that easily tracks errors in various applications. Sentry also provides a feature to handle the source maps of your application bundle.
We will see how to handle source maps with Sentry in five steps.
Step 1: Create an organization account
If you already have an account, you can proceed to step two. Otherwise, click the link below to create an account and follow the guide.

Once the account is created and your email address is verified, go to the next step.
Step 2: Create a Sentry project
Replace <org_name> by your organization's name in this link "https://<org_name>.sentry.io/projects" and open it in your browser.
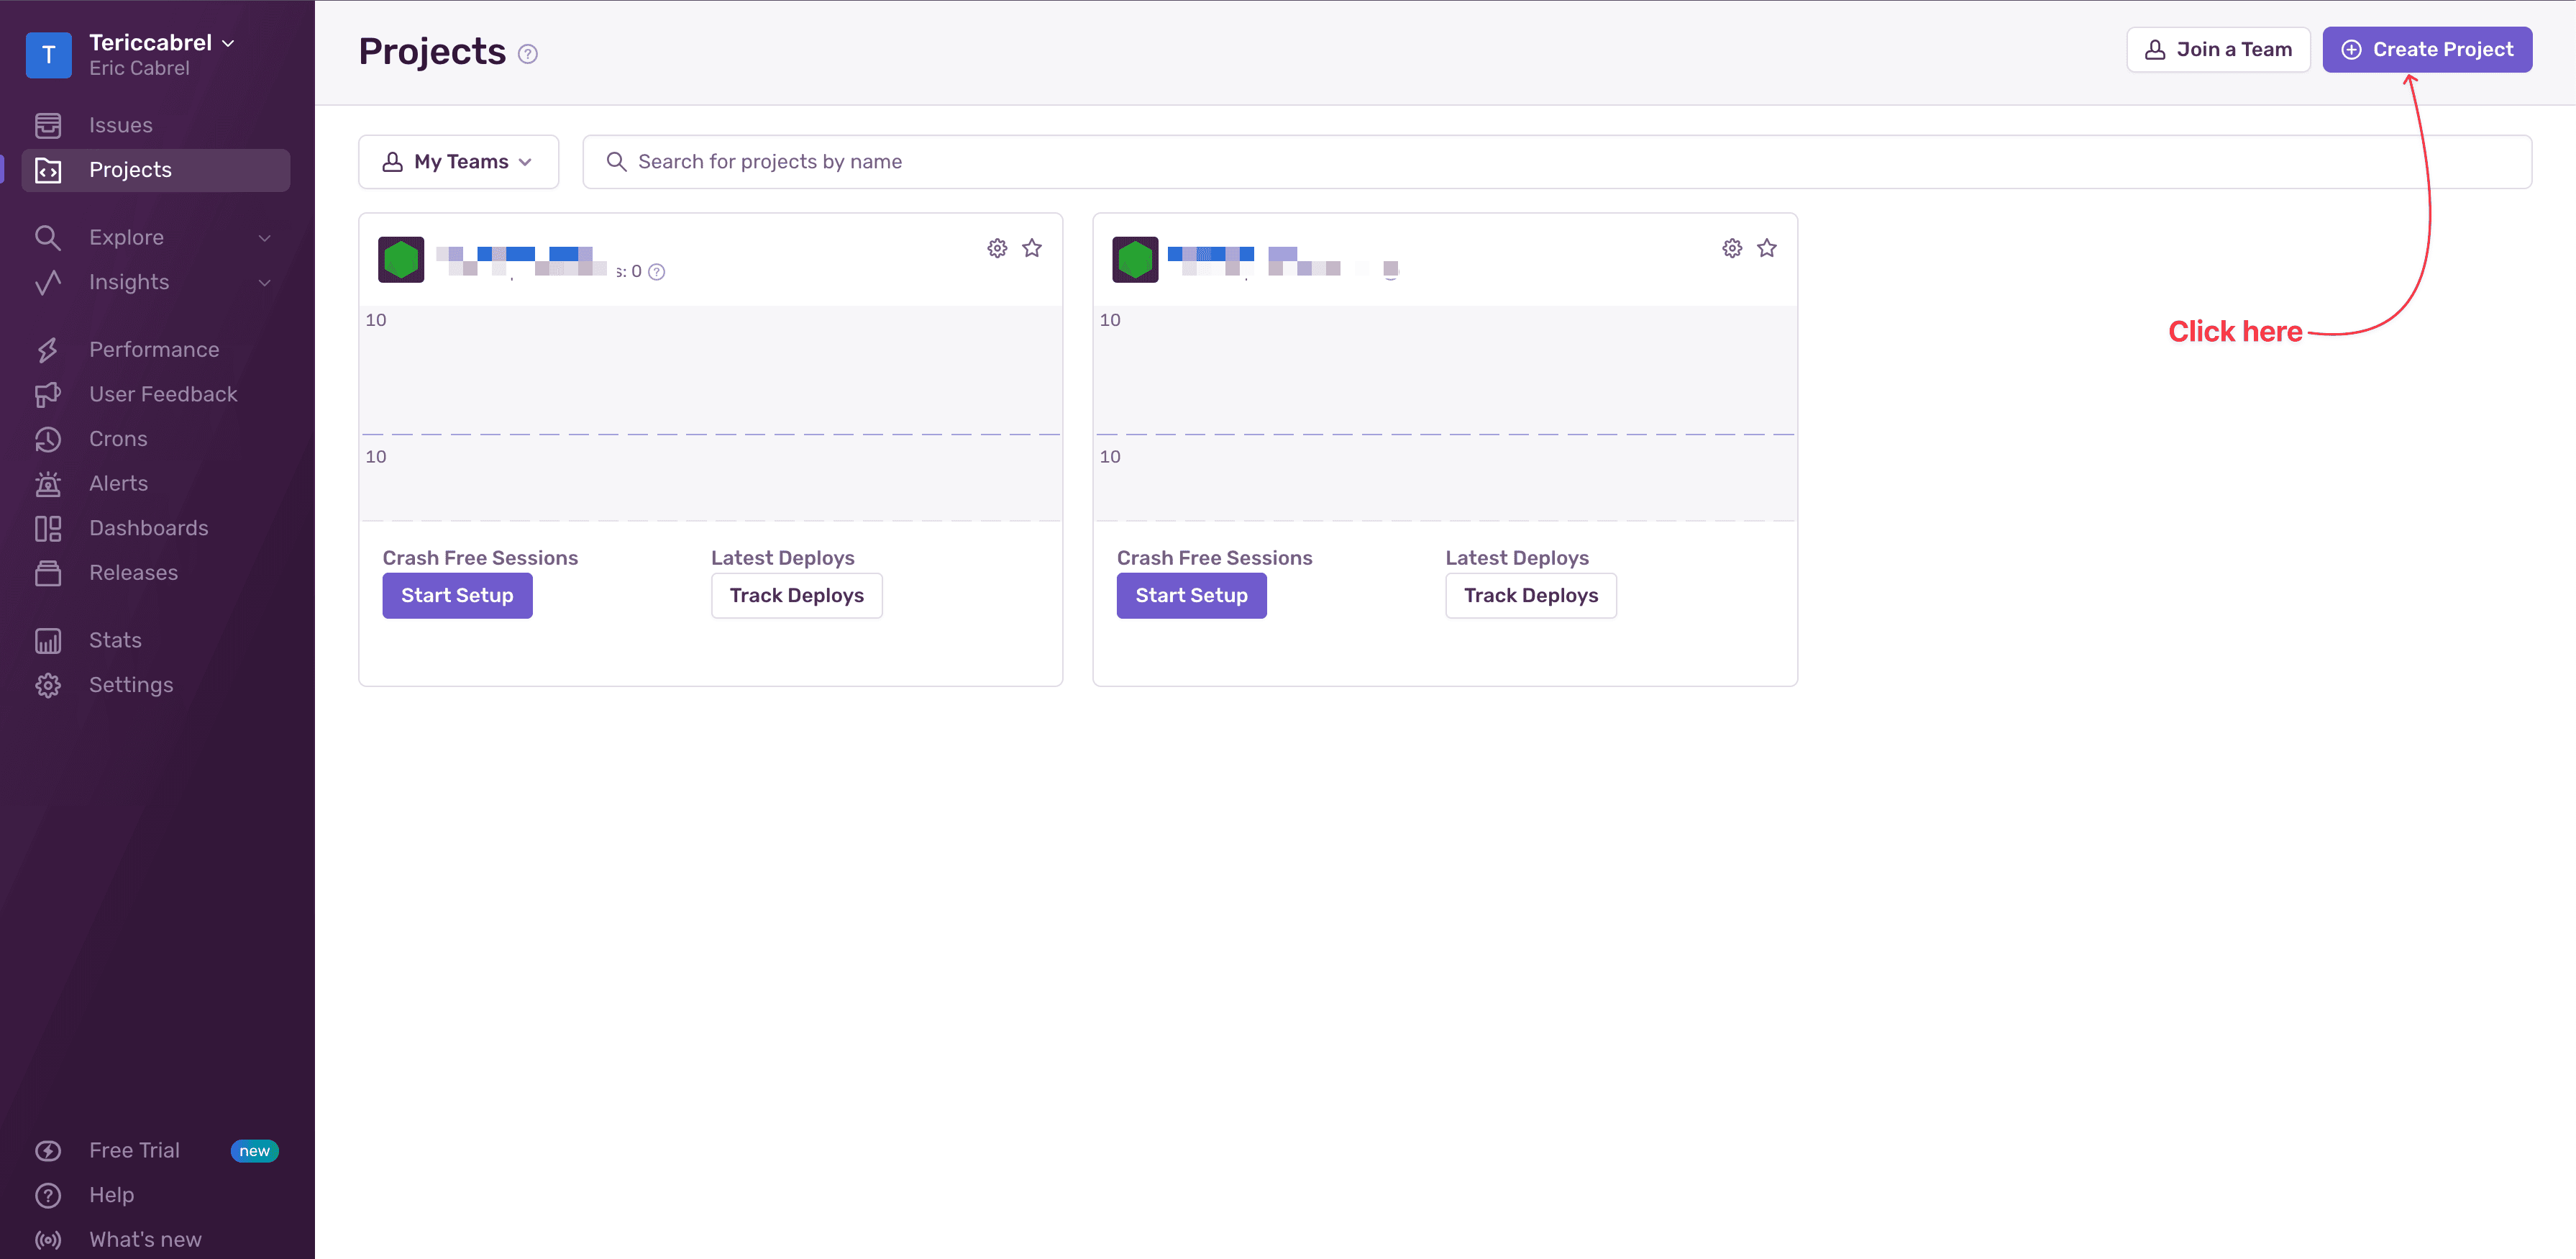
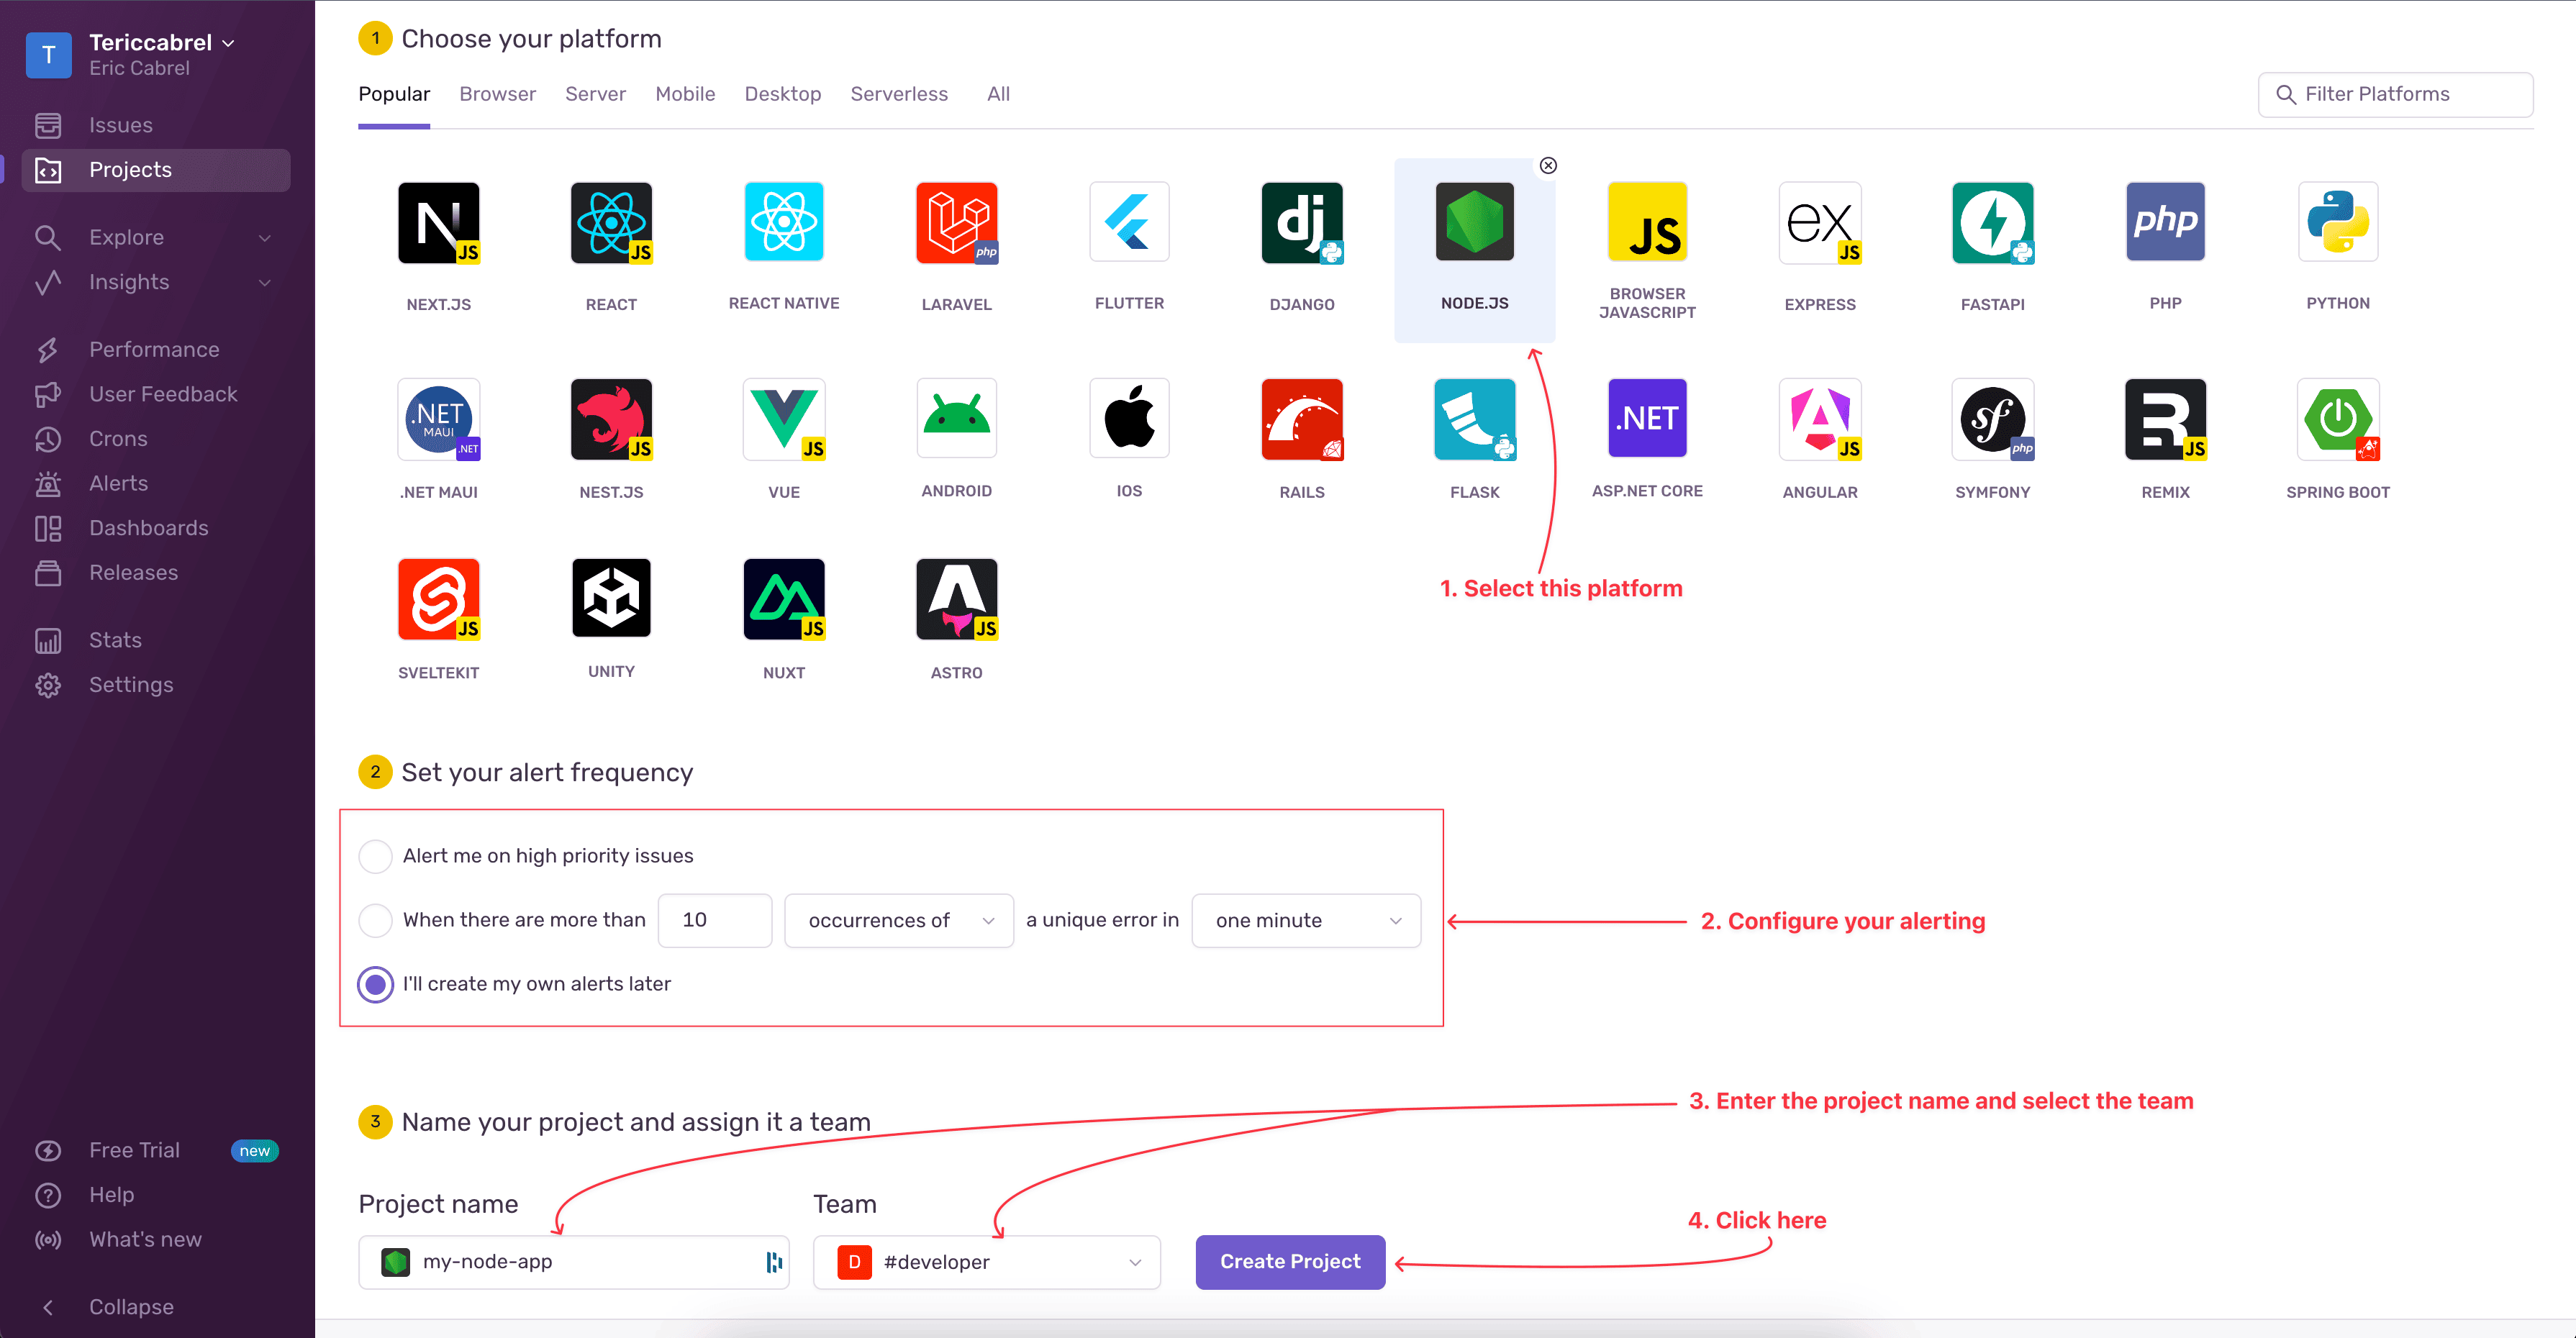
In the top-right of the page, click on the button "Create Project". You will be redirected to a page asking for three information for a new project:
- The platform: select Node.js
- The alert settings: keep the default settings or change them as you want.
- The project name: Give a name for the project.
Click on the button to create the project.
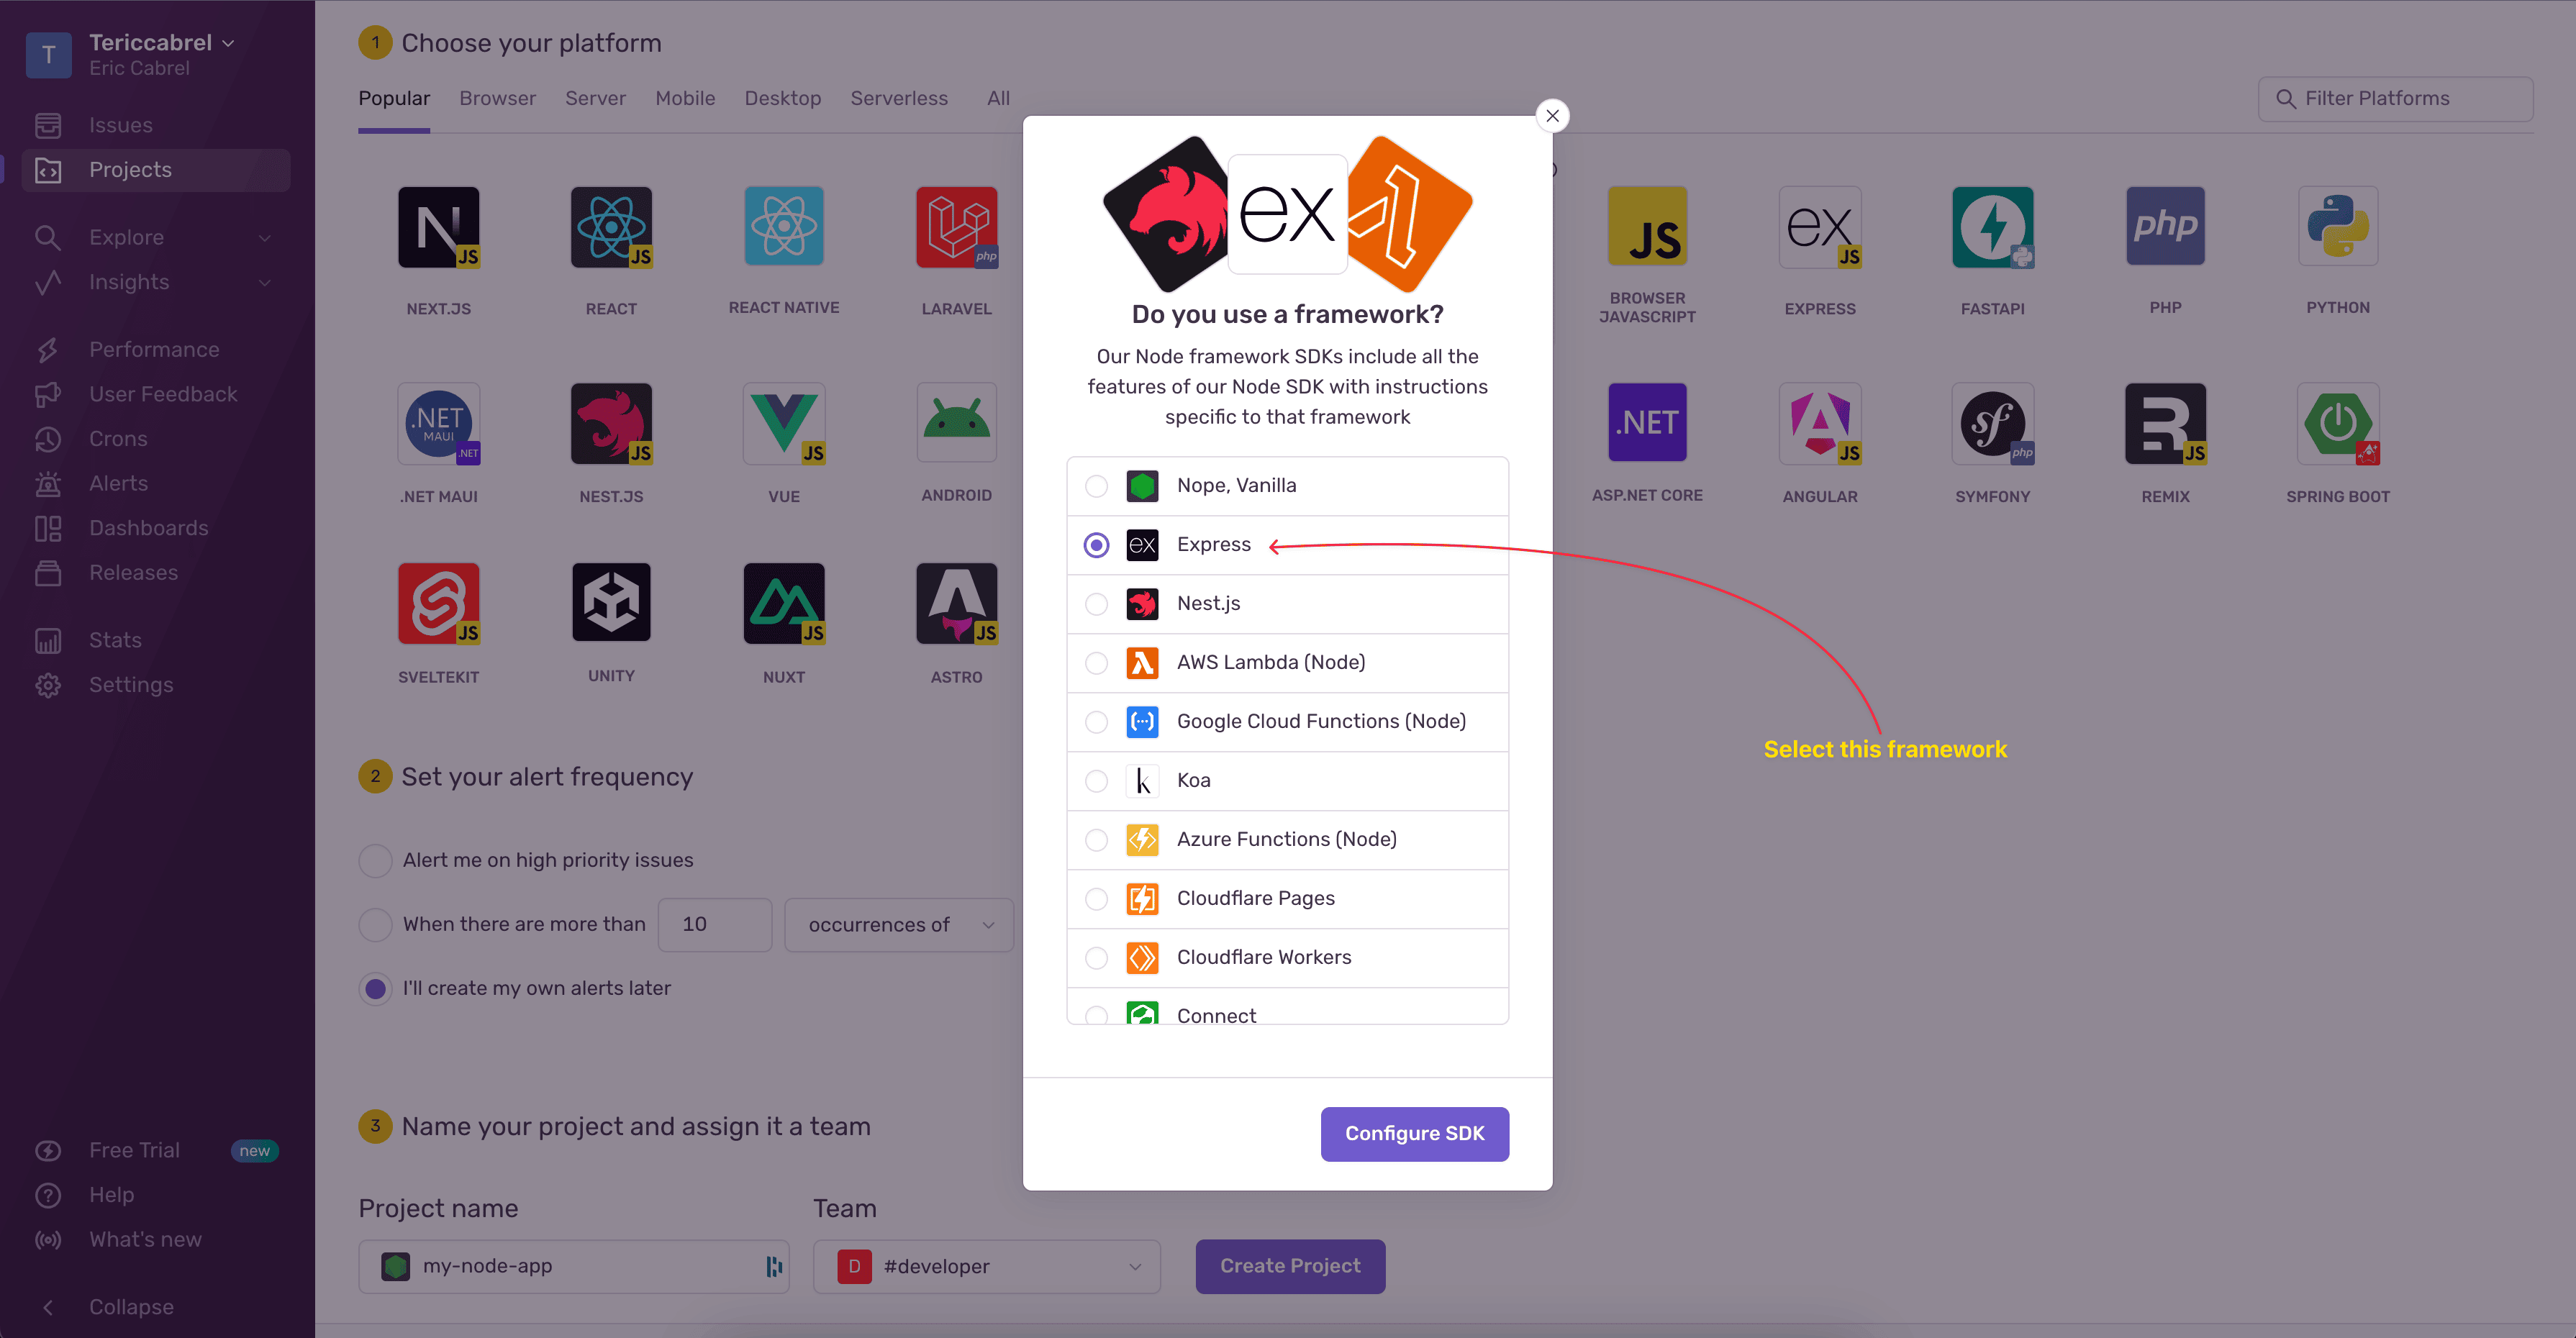
Once you click "Create Project" button, a modal dialog will appear asking you to select a Framework. Since we use the Express framework, select it and click "Configure SDK".
On the next page, you will find steps to configure Sentry. You can skip this step because we will do it next.
Step 3: Configure Sentry in a Node.js application
To configure Sentry for our Express application, we must install the Sentry dependency for Node.js. Run the command below to install it.
yarn add @sentry/node
Create a file "src/instrument.ts" and add the code below
import * as Sentry from '@sentry/node';

Sentry.init({
  dsn: <SENTRY_PROJECT_DSN>,
  tracesSampleRate: 1.0, //  Capture 100% of the transactions
});
Replace the "<SENTRY_PROJECT_DSN>" by the Sentry DSN of the project we created earlier.
To retrieve your Sentry DSN project, find or follow the project settings link "https://<org_name>.sentry.io/settings/projects/<project_name>".
On the project left menu, click on "Client Keys (DSN)" to copy the project DSN.
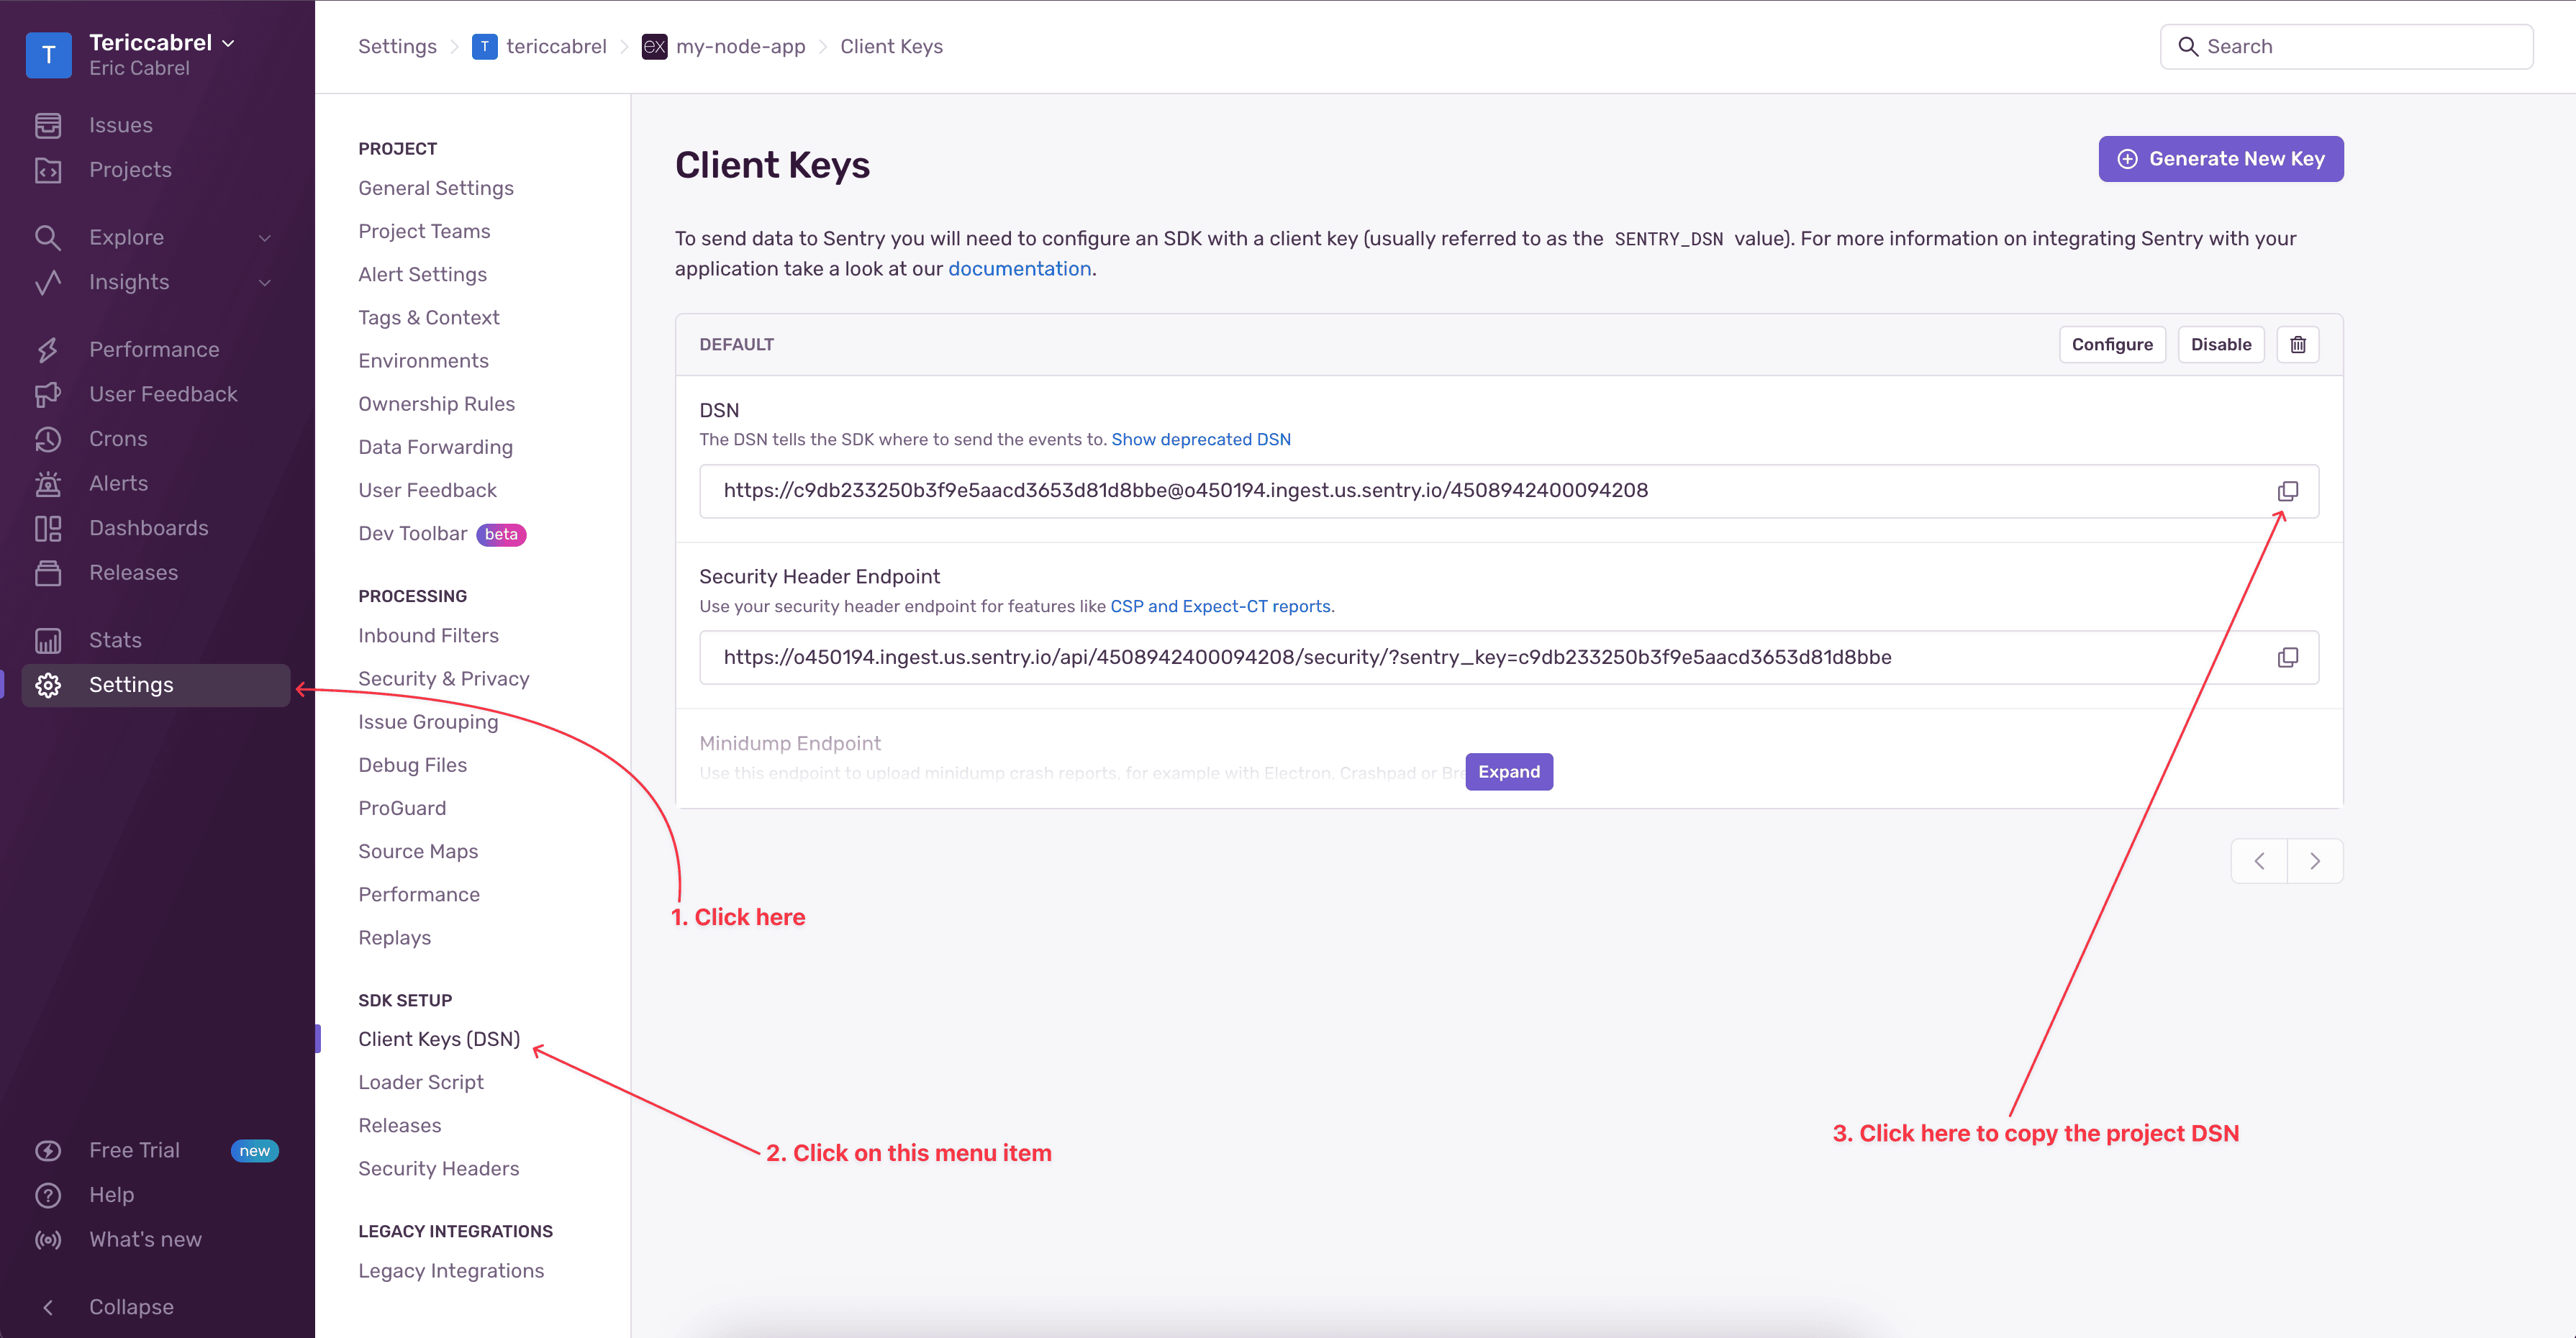
Set the project DSN in the "src/instrument.ts" file.
It is not recommended to hardcode sensitive values in the application; instead, load them from the environment variables. Read my blog post below to learn how to do that.

In the "src/index.ts" file, we will import the "src/instrument.ts" file, which must be the first import of the file. We will also configure global middleware for Sentry to capture exceptions.
Replace the code of the "src/index.ts" with the code below:
import './instrument';

import * as Sentry from '@sentry/node';
import express from 'express';
import dotenv from 'dotenv';

import { setupRoute } from './route';

dotenv.config();

const HOST = process.env.HOST || 'http://localhost';
const PORT = parseInt(process.env.PORT || '4500');
let requestCount = 0;

const app = express();


app.use(express.urlencoded({ extended: true }));
app.use(express.json());

app.get('/', (req, res) => {
  requestCount++;

  return res.json({
    message: 'Hello World!',
    numberOfCall: requestCount,
  });
});

setupRoute(app);

// The error handler must be registered before any other error middleware and after all controllers
Sentry.setupExpressErrorHandler(app);

app.listen(PORT, () => {
  console.log(`Application started on URL ${HOST}:${PORT} 🎉`);
});
Step 4: capture exception and send it to Sentry
With the setup we did in the previous step, Sentry can now capture uncaught exceptions in our application; but for errors that occur in a code wrapped with a try { } catch () block, we must manually send the error to Sentry.
Let's update the file "src/route.ts" to capture the error when we call the route "/error"
import { captureException } from '@sentry/node';
import { Application } from 'express';

export const setupRoute = (app: Application) => {
  app.get('/error', (req, res) => {
    try {
      if (Math.random() > 0.5) {
        throw new Error('Ka booom!');
      }

      return res.json({ message: 'Success!' });
    } catch (error) {
      captureException(error);

      return res.status(400).json({ message: 'Ops error!' });
    }
  });
};
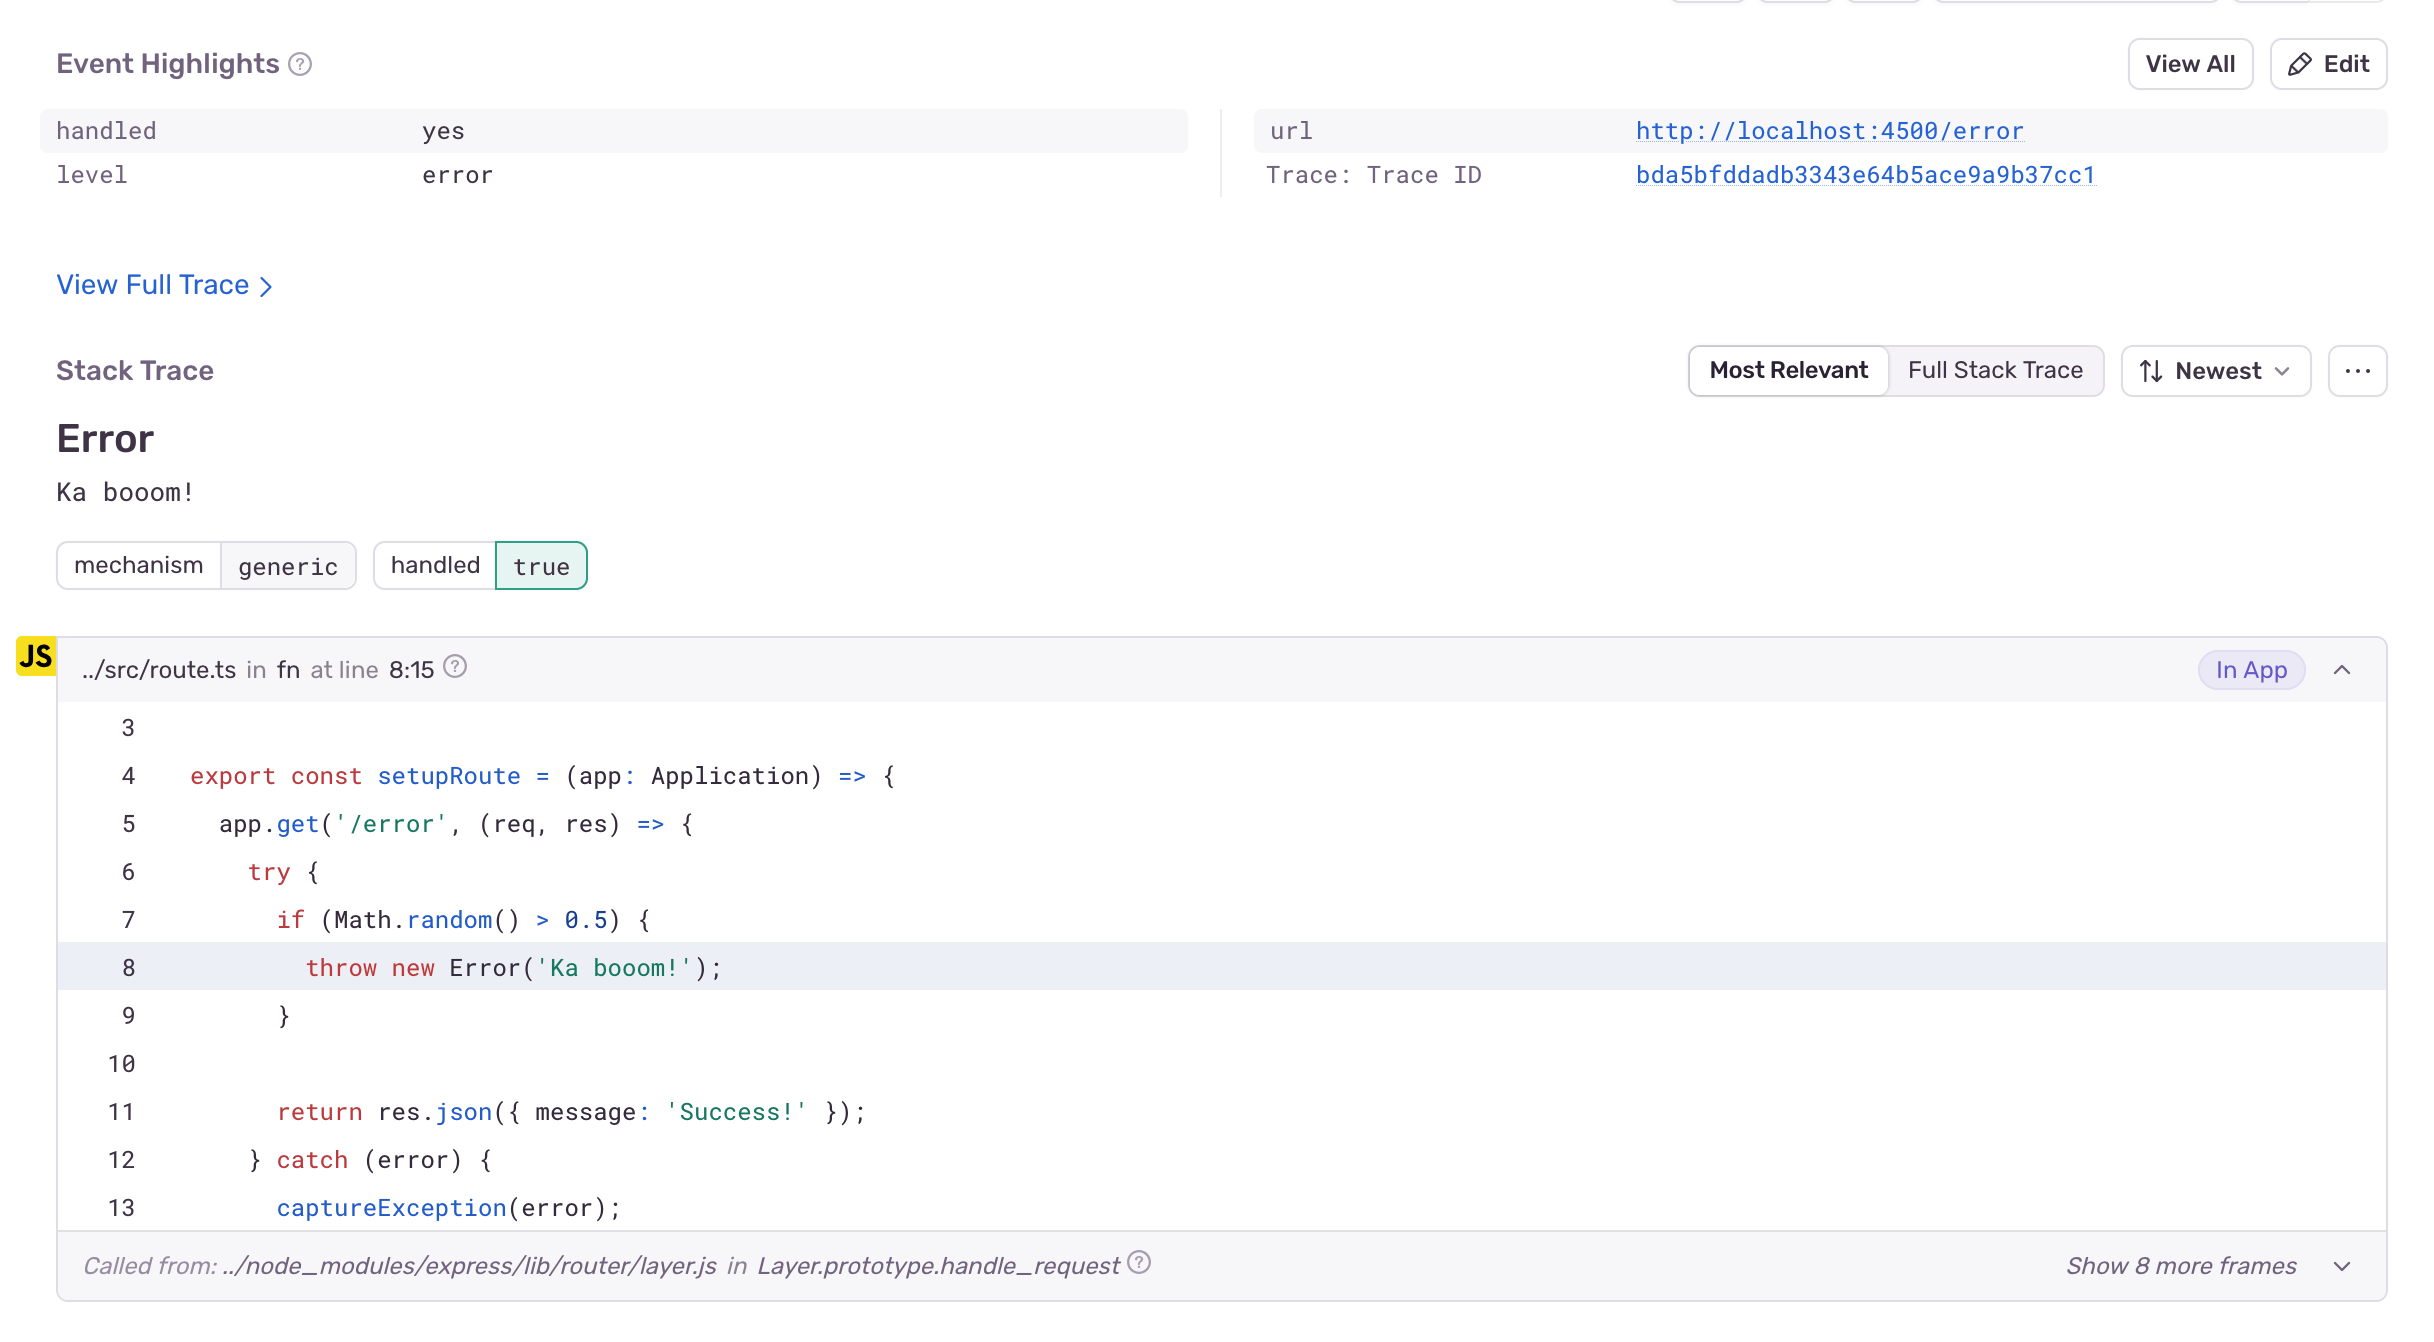
Run the application with the command "yarn start" and navigate to http://localhost:4500/error. Refresh the page until it sends an error message, then go to the Sentry project to see the issue.
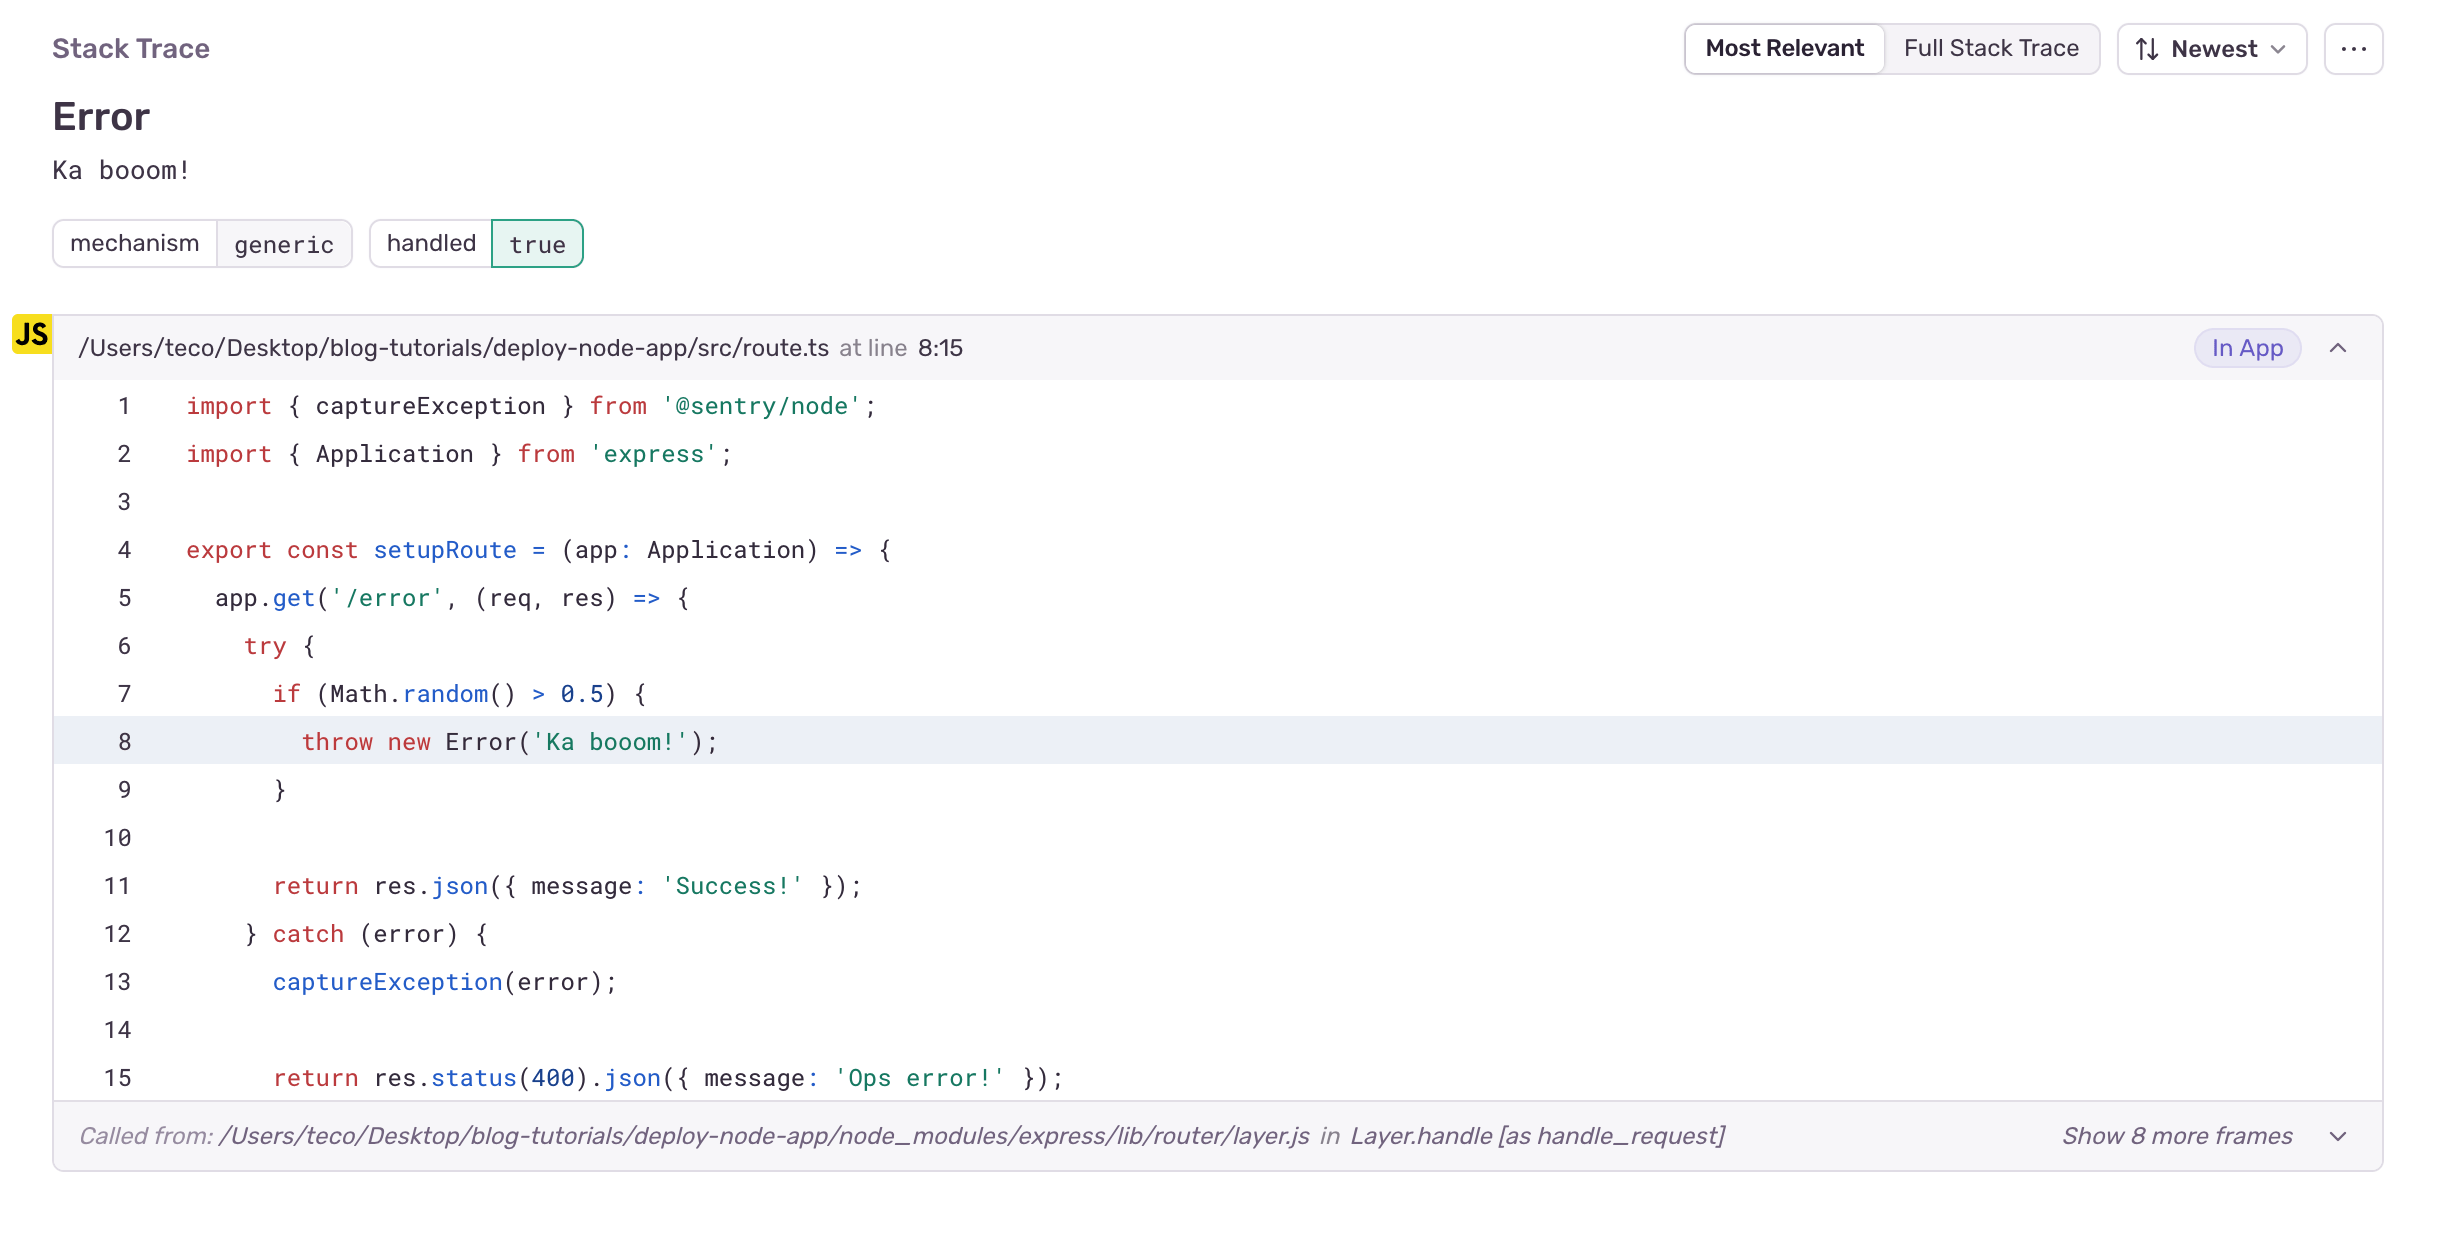
We can clearly see where the error occurred in our code; we would expect the same experience in production bundled with Esbuild.
Build the application with Esbuild and run it.
yarn esbuild ./src/index.ts --bundle --minify --sourcemap --platform=node --outfile=build/index.js

node build/index.js
You can see that the bundle size increased because we added the Sentry dependency, and the source maps file is almost four times bigger than the source code file.
Ignore the Sentry message about Express not being instrumented.
Refresh the URL again until you get the error, then go to Sentry to see the issue.
Running the application with Source maps enabled can fix this, but as we said before, it is not recommended, so let's use Sentry to fix it.
Upload source maps to Sentry
With Sentry, you can upload the application's source maps. When an error stack trace is sent to Sentry, the uploaded source maps are used to resolve it, following the real structure of the application's source code.
We will use the Sentry CLI to create a release and upload the source maps, so let's install it on our computer.
curl -sL https://sentry.io/get-cli/ | bash

sentry-cli --version
To create a release, you need an authorization token, go to the project, click on the menu "Release"
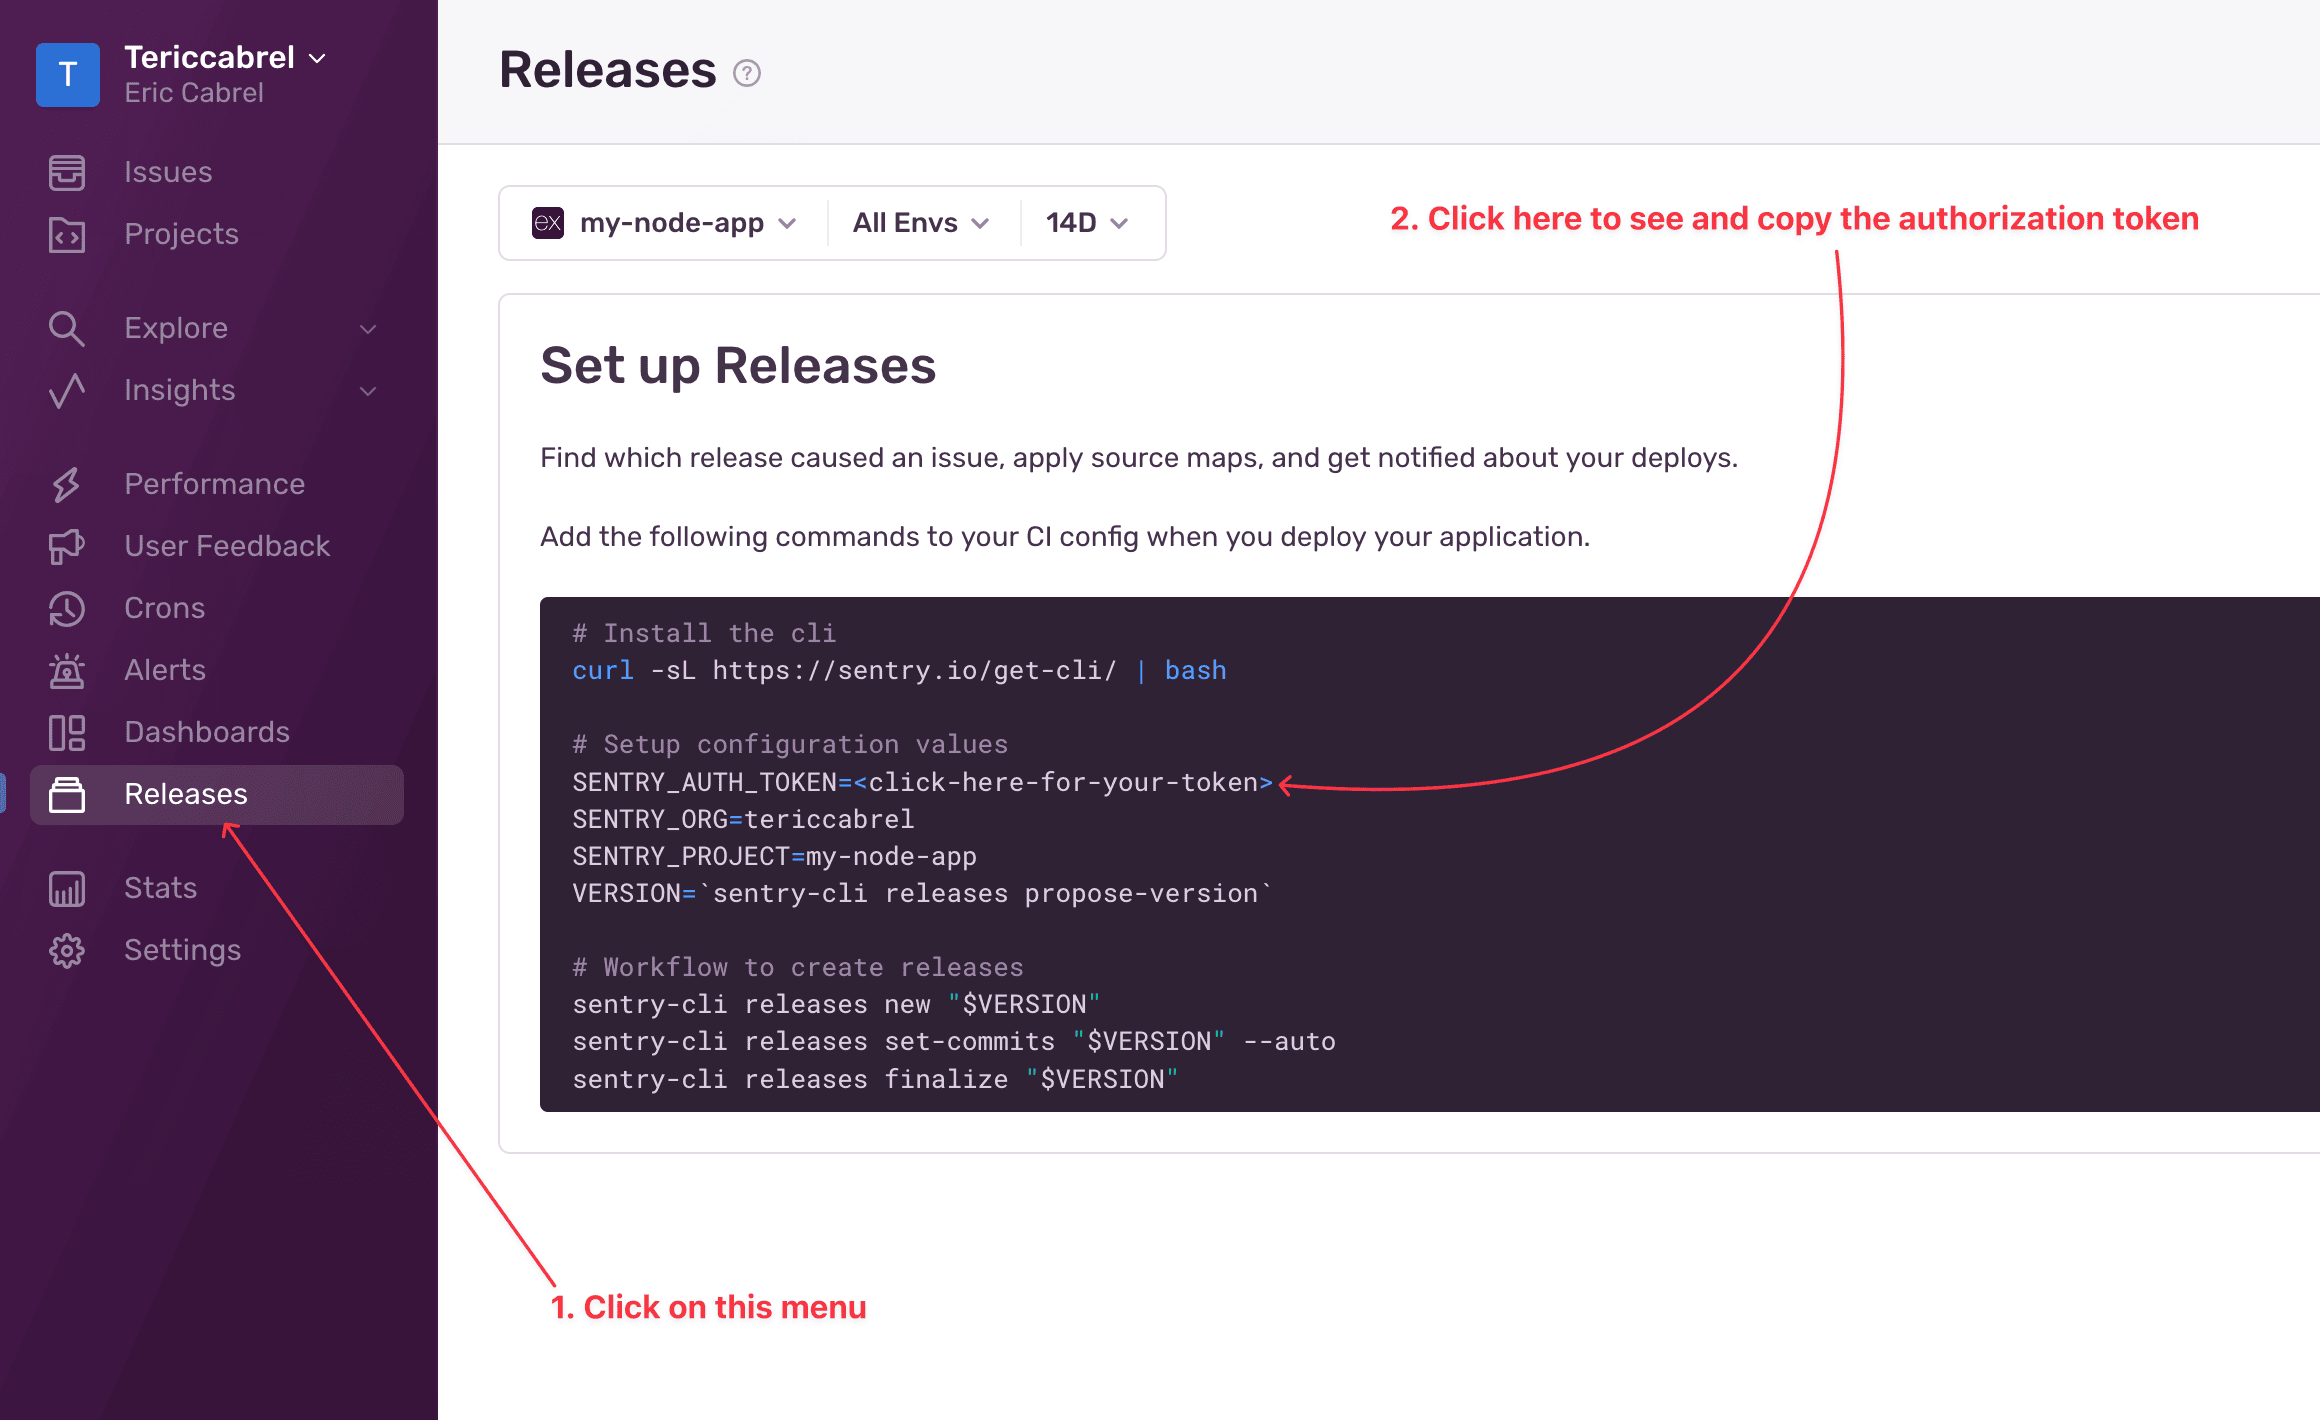
Copy your authorization token and keep it somewhere; we will use it later.
The commands to create a release with source maps slightly differ from those in the picture above. Run the commands below.
export SENTRY_AUTH_TOKEN=<your_sentry_auth_token>
export SENTRY_ORG=<org_name>
export SENTRY_PROJECT=<project_name>
export VERSION=1.0.0

# Workflow to create releases
sentry-cli releases new "$VERSION"

# Upload source maps
sentry-cli sourcemaps inject ./build
sentry-cli sourcemaps upload --release=$VERSION ./build

# Finish the release
sentry-cli releases finalize "$VERSION"
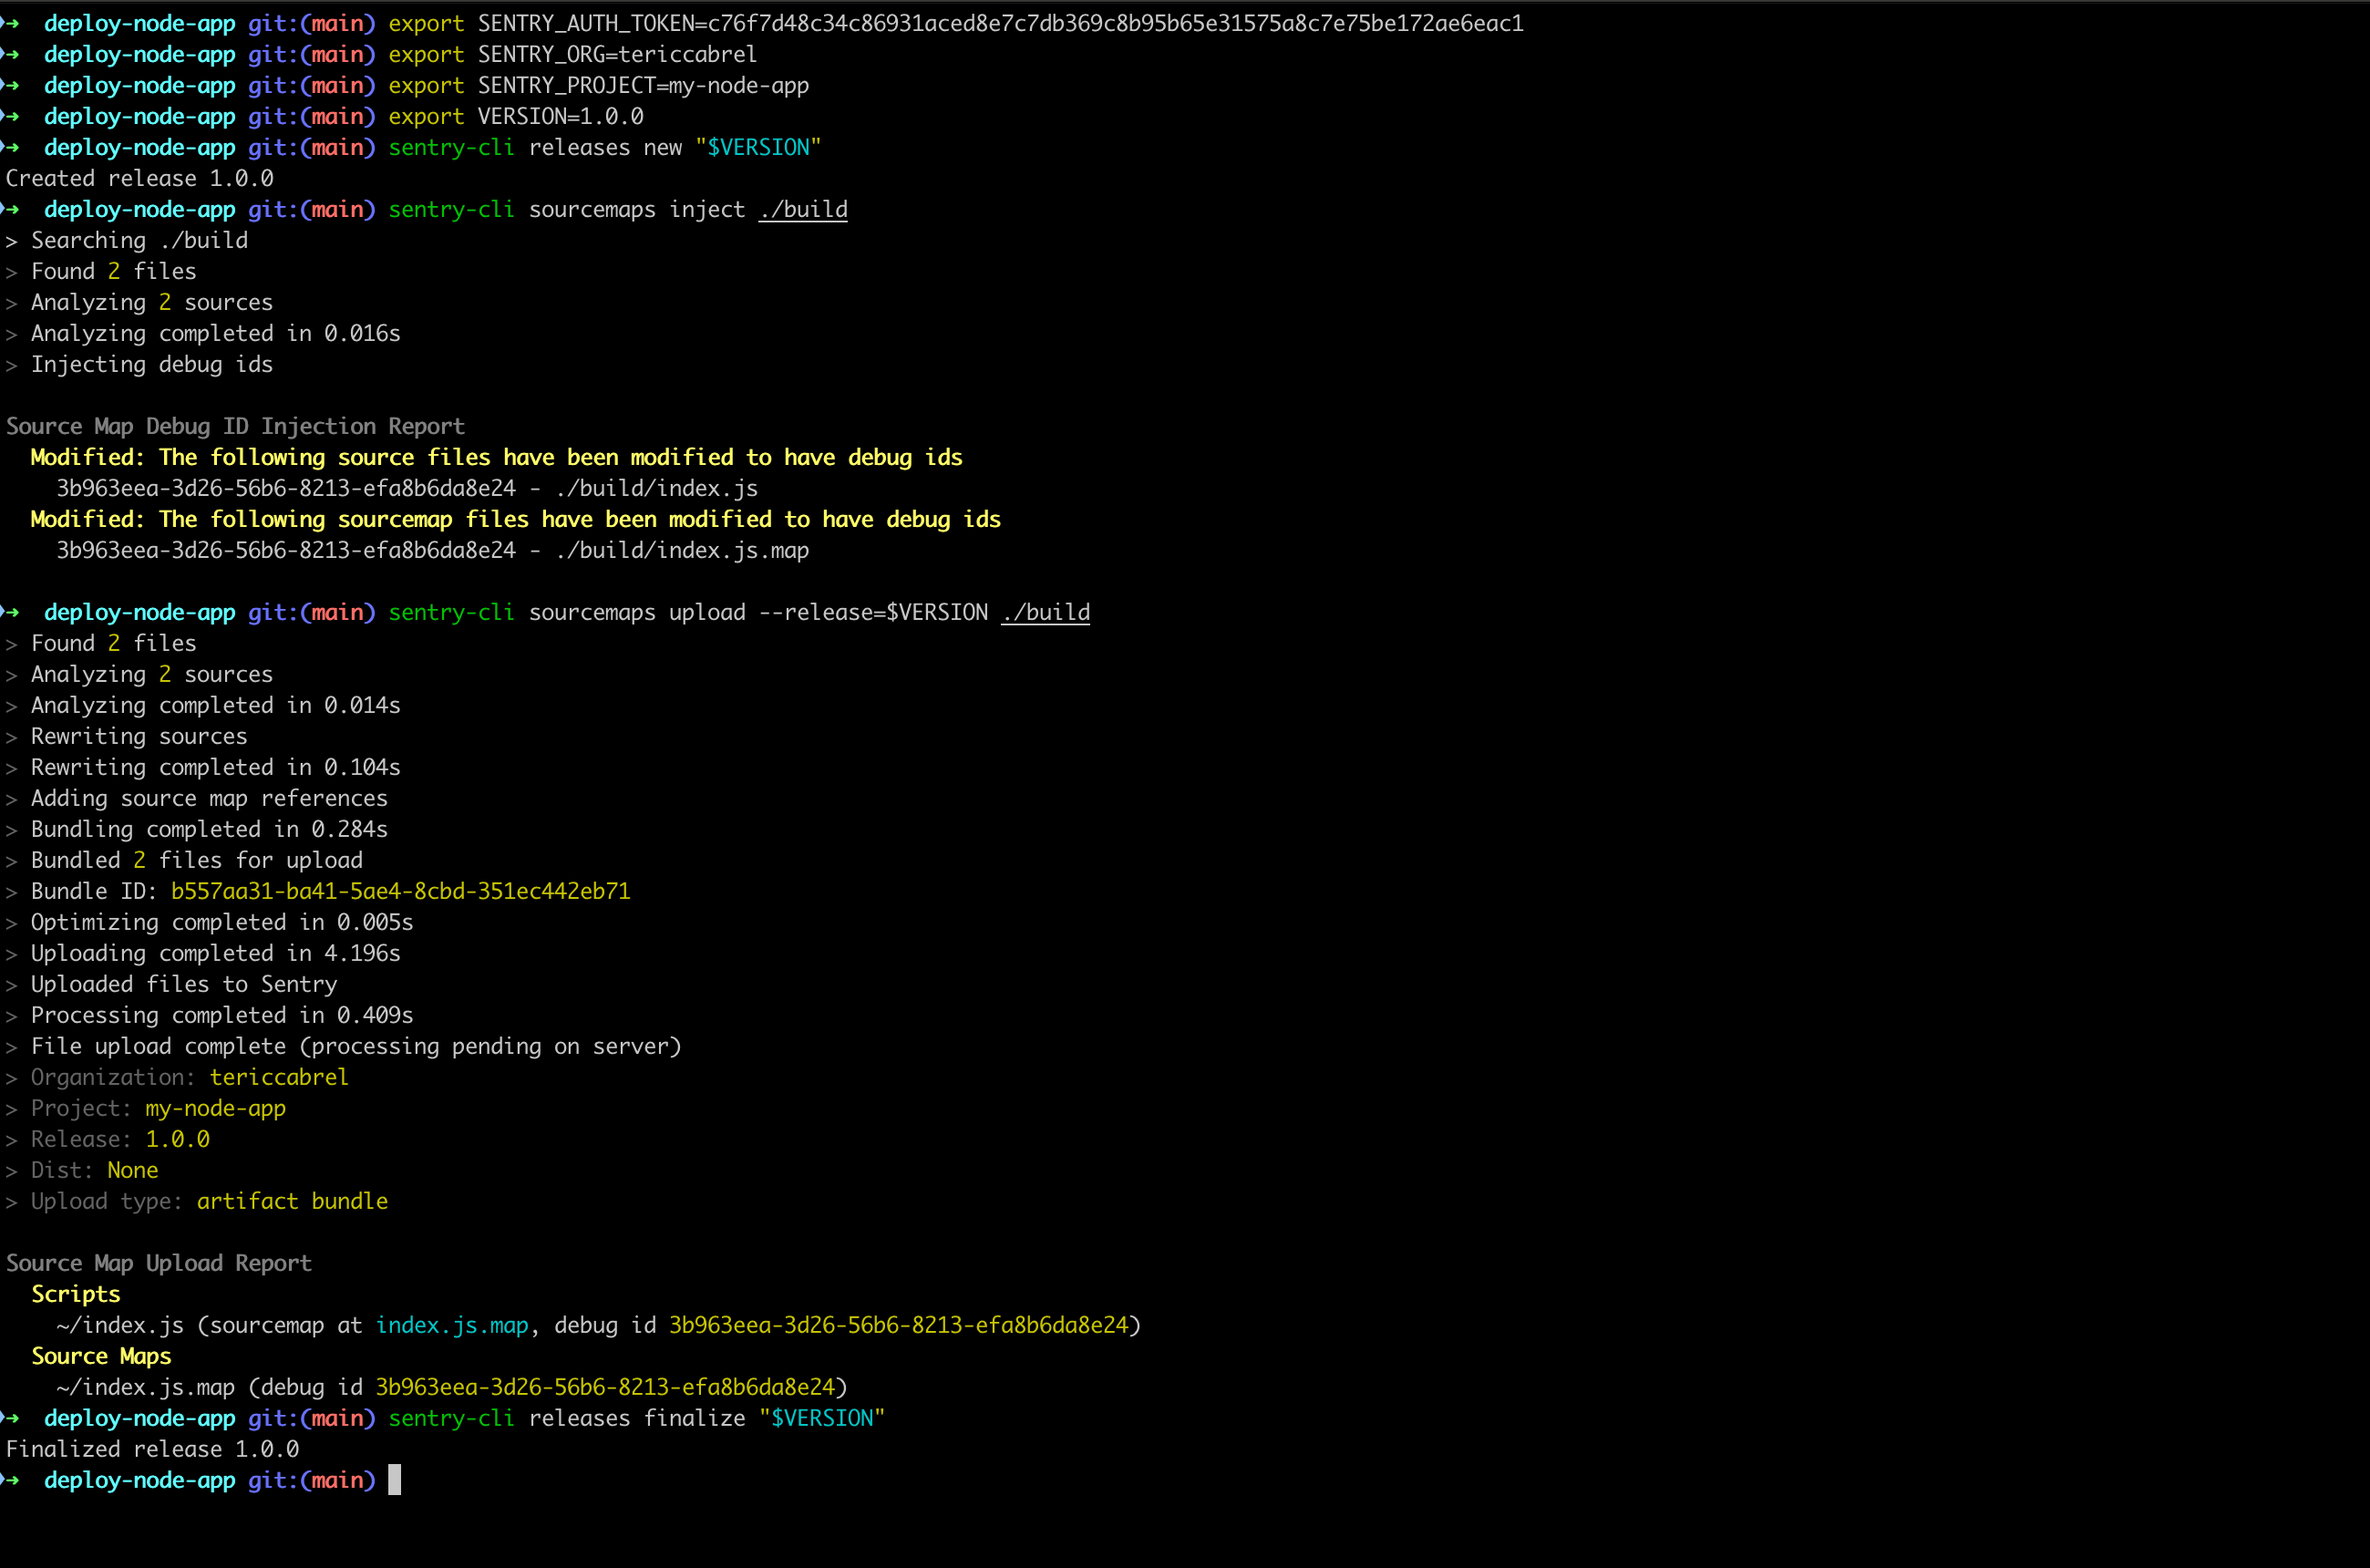
Replace the SENTRY_AUTH_TOKEN, SENTRY_ORG and SENTRY_PROJECT by your own.
Note 2: The command
sentry-cli sourcemaps upload --release=$VERSION ./build uploads everything in the build folder, and links the source maps to the release. We get the following output:
You can see the releases by clicking on the menu "Releases" of the project
Re-run the application bundled for production without enabling sourcemaps
node build/index.js
Navigate to http://localhost:4500/error and refresh the page until an error message appears. Then, go to the project's issues in Sentry.
We can now see a code source that threw the error.
Associate a Sentry release to the application release
To resolve the stack trace of an error, Sentry will use the most recent source maps uploaded event if it is not associated with a release. This can cause problems if you deploy a new code in production, but do not upload the source maps.
To prevent this, you can set a release version when initializing Sentry in the application and then use that same version when creating a release with source maps.
Let's say you want to do a new release with the version 1.1.0
Update the "src/instrument.ts" file and set the release in the Sentry initialization; the value is read from the environment variable "APP_VERSION"; this assumes the release version is the same as the application version.
import * as Sentry from '@sentry/node';

Sentry.init({
  dsn: '<SENTRY_PROJECT_DSN>',
  tracesSampleRate: 1.0, //  Capture 100% of the transactions
  release: process.env.APP_VERSION,
});
Build the application with Esbuild and create the release 1.1.0 as we saw earlier. Once done, run the application with the following code:
APP_VERSION=1.1.0 node build/index.js
Refresh the browser page until you get the error and go to Sentry to see the issue.
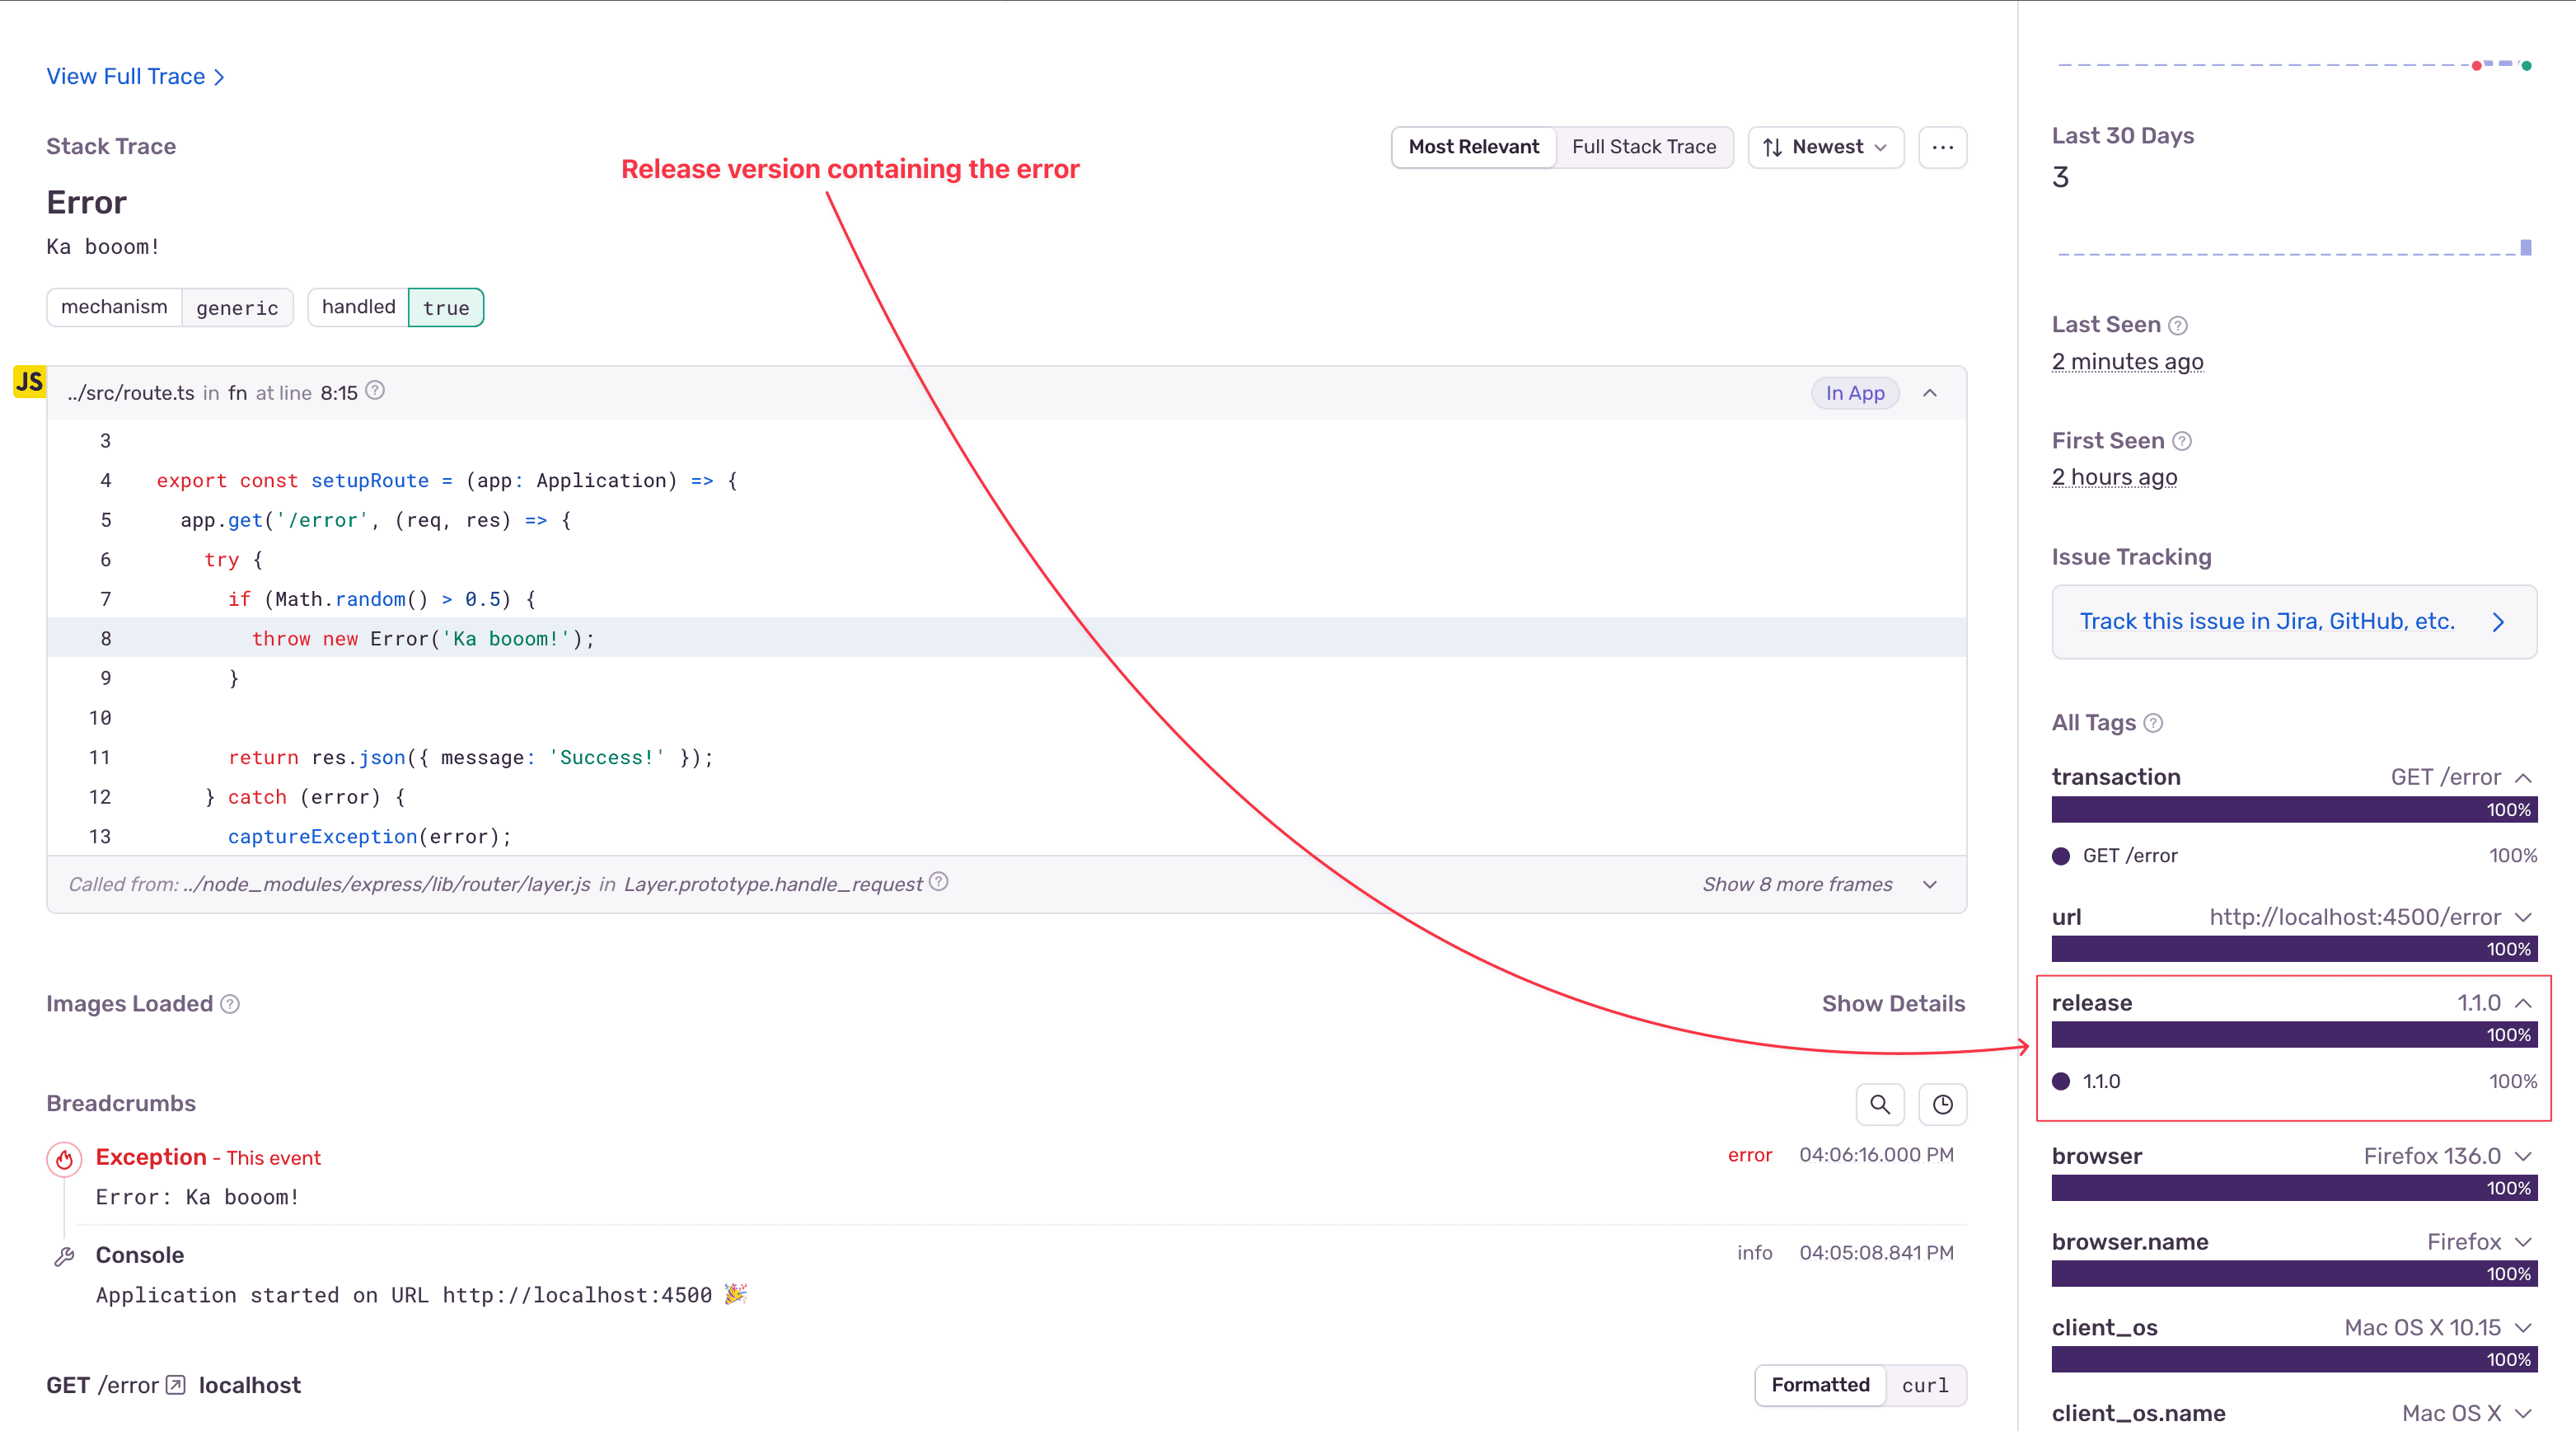
Now, once a bug occurs,
- You can view the detailed error, the file, and the line raising the error.
- You can see the release version that introduced the bug.
Automate the release with GitHub Actions
Associating a Sentry release to the application source maps must succeed in production to have a good stack trace, but it's easy to make a mistake when doing it manually.
To ensure the release is done automatically, we will build a CI/CD pipeline on GitHub Actions to perform this action every time we release our application.
Every time we merge on the "main" branch, we want to
- Get the new release version,
- Build the project for production,
- Create a release and upload the source maps to Sentry
- Package the application with the release version injected as an environment variable.
Create a ".github/workflows/build.yaml" and add the code below:
name: Build and release the project
on:
  push:
    branches: [ main ]

env:
  SENTRY_AUTH_TOKEN: ${{ secrets.SENTRY_AUTH_TOKEN }}

concurrency:
  group: "${{ github.workflow }}-${{ github.head_ref || github.run_id }}"
  cancel-in-progress: true

jobs:
  build-and-release:
    runs-on: ubuntu-24.04
    steps:
      - uses: actions/checkout@v4

      - name: Cache Node.js modules
        uses: actions/cache@v4
        with:
          path: node_modules
          key: "${{ runner.os }}-yarn-${{ hashFiles('**/*.yarn.lock') }}"
          restore-keys: ${{ runner.os }}-yarn-

      - name: Set up Node 22
        uses: actions/setup-node@v4
        with:
          node-version: '22'
          registry-url: 'https://registry.npmjs.org'

      - name: Install Node,js dependencies
        run: yarn install

      - name: Lint the projects
        run: yarn lint

      - name: Build the projects
        run: yarn tsc -b

      - name: Run tests
        run: echo "No tests to run"

      - name: Generate Application Version
        run: |
          RELEASE_VERSION=$(cat package.json | jq -r '.version')
          echo "APP_VERSION=$RELEASE_VERSION" >> $GITHUB_ENV

      - name: Build Project for Production
        run: |
          yarn esbuild ./src/index.ts --bundle --minify --sourcemap --platform=node --outfile=build/index.js

      - name: Install Sentry CLI
        run: |
          curl -sL https://sentry.io/get-cli/ | bash
          echo "export PATH=$PATH:$HOME/.local/bin" >> $GITHUB_ENV

      - name: Release and upload source maps
        env:
          SENTRY_AUTH_TOKEN: ${{ secrets.SENTRY_AUTH_TOKEN }}
          SENTRY_ORG: tericcabrel
          SENTRY_PROJECT: my-node-app
          SENTRY_RELEASE: ${{ env.APP_VERSION }}
        run: |
          sentry-cli releases new "$SENTRY_RELEASE"
          sentry-cli sourcemaps inject ./build
          sentry-cli sourcemaps upload --release=$SENTRY_RELEASE ./build
          sentry-cli releases finalize "$SENTRY_RELEASE"

      - name: Build the Docker image
        run: |
          docker build --build-arg APP_VERSION=${{ env.APP_VERSION }} -t tericcabrel/my-node-app:latest .
          # TODO: tag and push the image to a Docker repository
The above GitHub Action reads the environment variable from the GitHub repository secrets, so you must add it before running the workflow.
Add the Sentry Auth token to the GitHub Actions secrets.
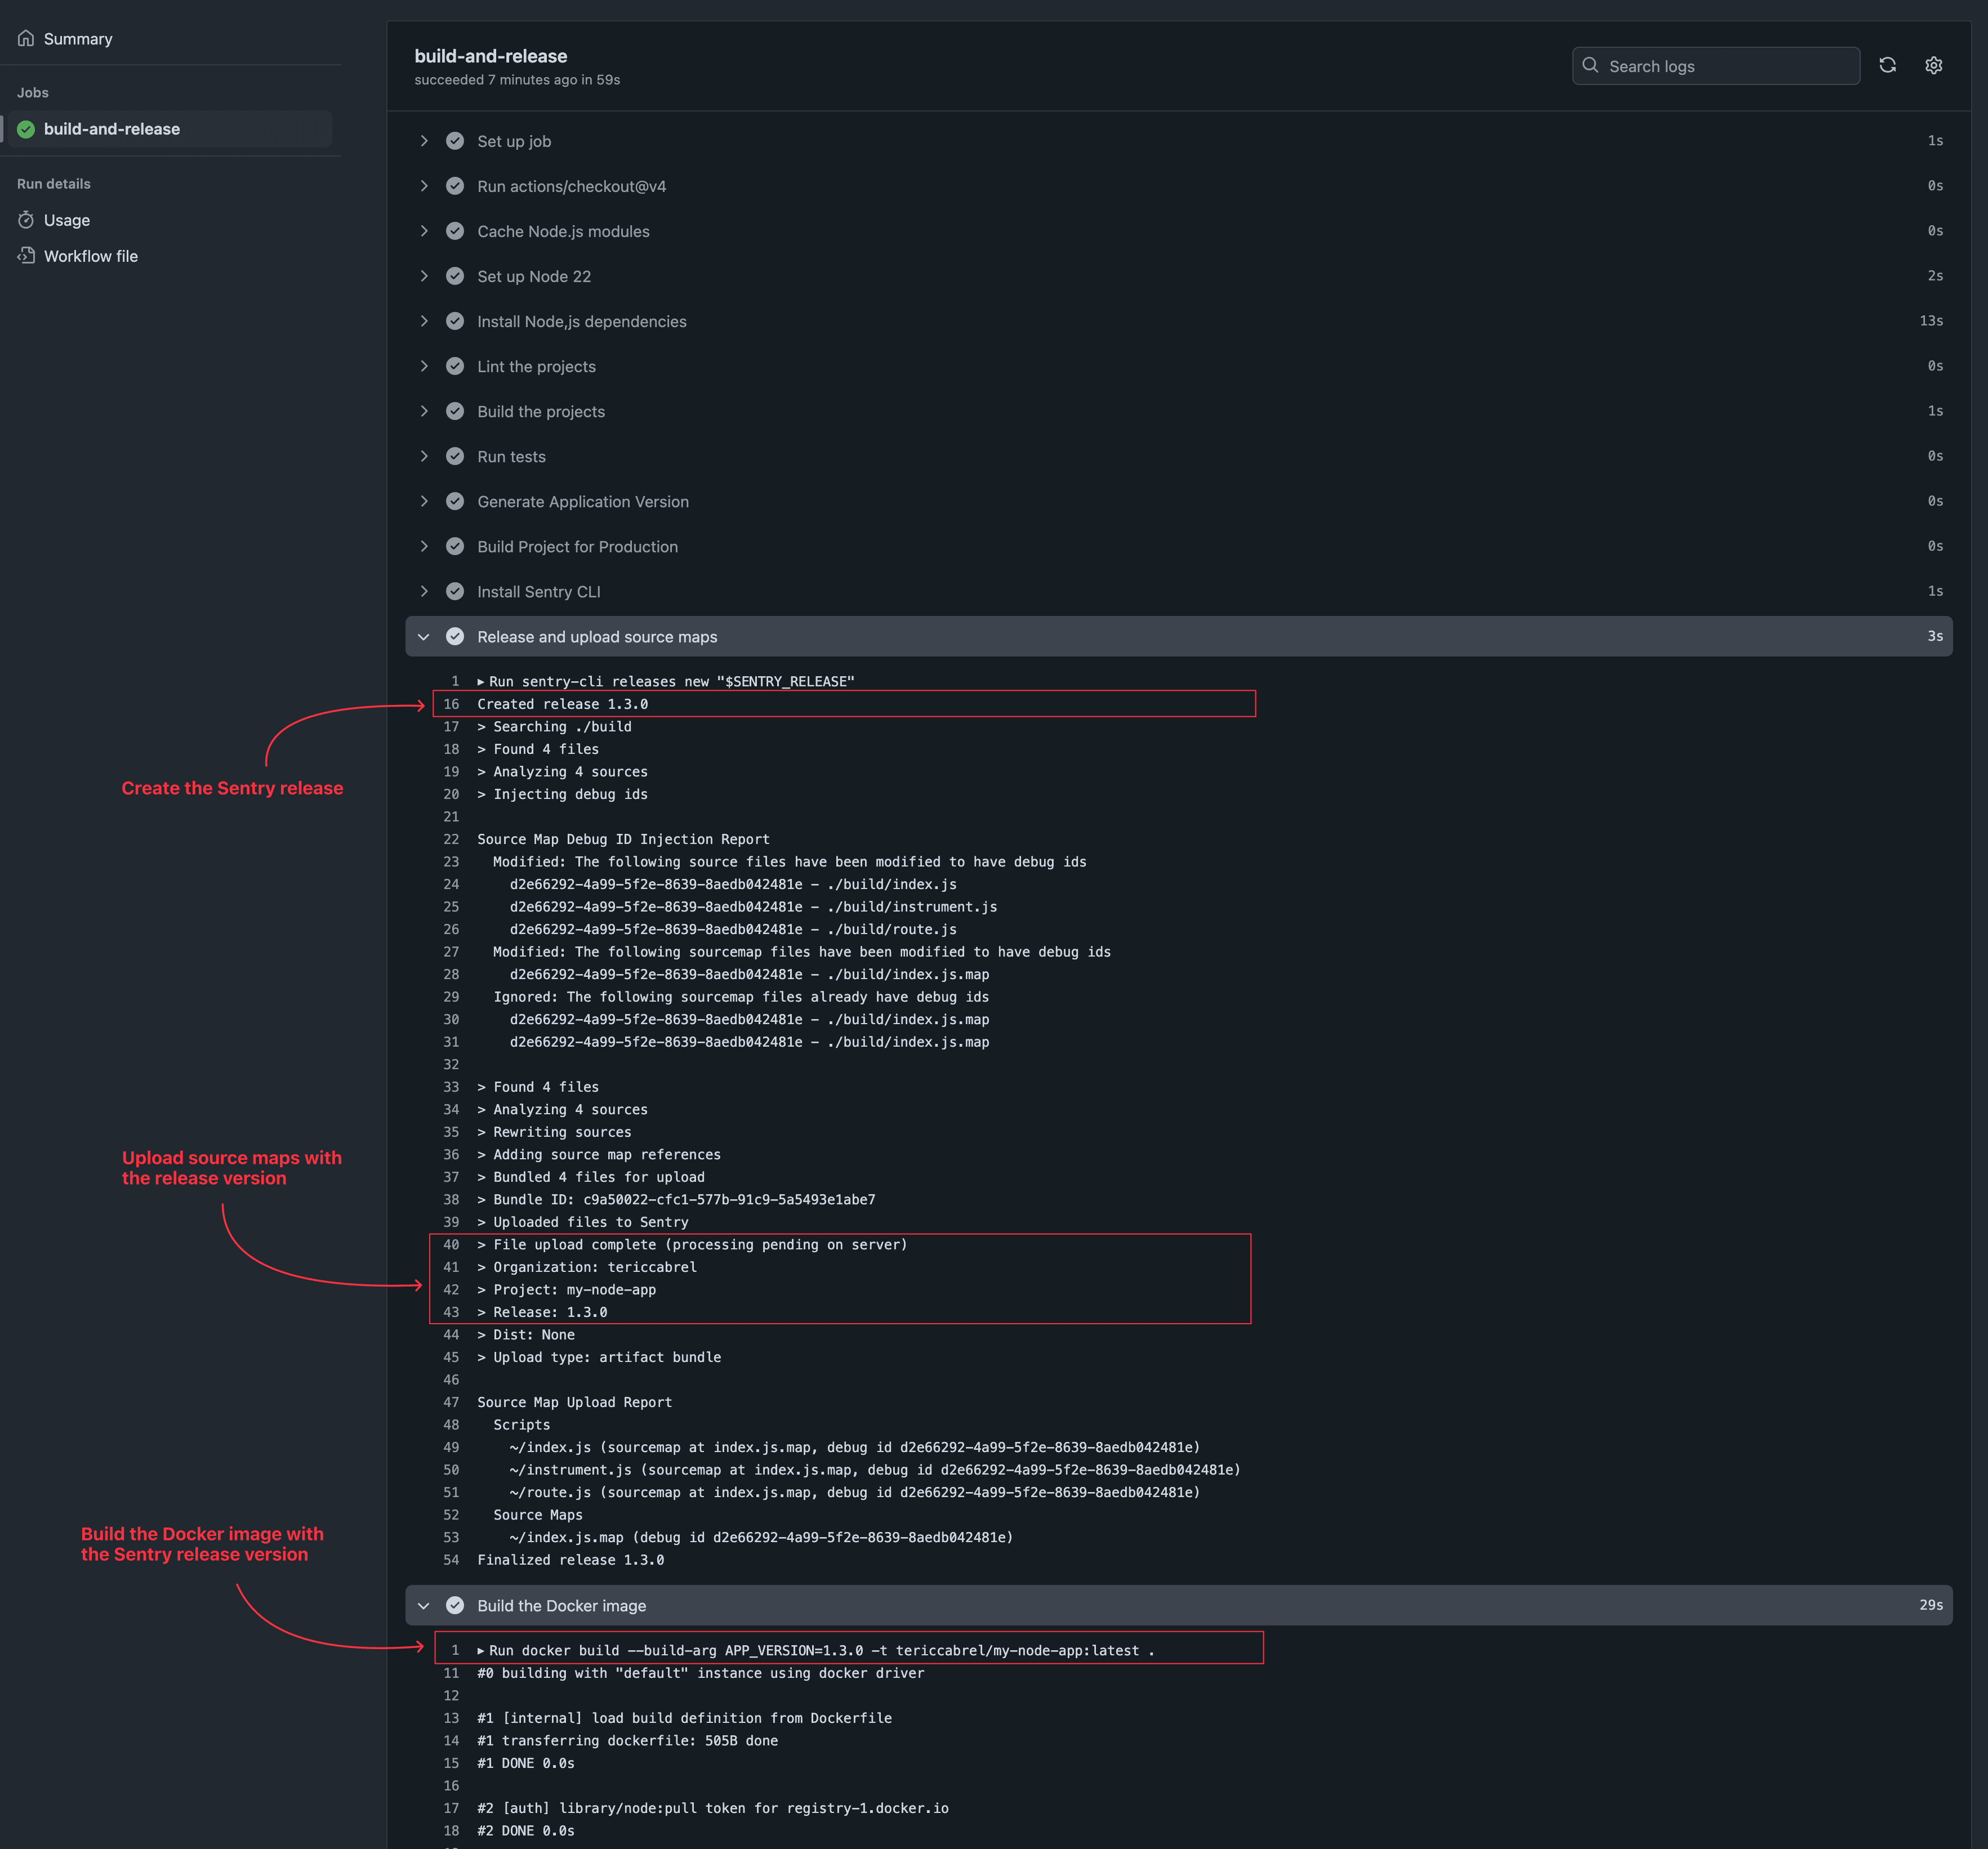
Create a Git commit, push on the main branch and wait for the CI to complete. You get the following output:
You can find the Docker file used in the final code
Wrap up
Reducing bundle size to improve performance often comes with difficulty debugging when an error occurs. By using Sentry, you can get the best of both worlds by uploading the source maps of your bundle.
While you can upload source maps alone, a better approach is to create a Sentry release and link the source maps to it so that when an error is thrown, Sentry can show you a detailed error stack and point to the release containing the bug.
Automating the Sentry release and uploading source maps in the CI/CD pipeline is essential to prevent a mismatch between the source maps used to build the detailed error stack and the code running in production.
You can find the code source on the GitHub repository.
Follow me on Twitter or subscribe to my newsletter to avoid missing the upcoming posts and the tips and tricks I occasionally share.